This article is focused on how to do troubleshoot the Logical standby database and monitoring the logical standby database apply, In detail we will go through how the SQL Apply process actually works and walk through with various views to monitor logical standby database.
Logical Standby Database
To be frank, in real world very few customers will consider using logical standby and many of many use Physical standby database when it comes to High availability solutions. Indeed for Logical standby we should not use term as "High availability Solutions" like Physical standby. Logical standby introduced with read and write capability so that DDL, DML on Logical standby and also recovery will be in progress from primary database. You must know that logical standby and primary databases Logical standby is no more considered as mirror to the primary database. When it comes with Physical standby database it is considered and meant for only Recovery/MRP and with the Active Data Guard feature of 11g you can offload reports/job to standby from primary so that resources can be saved on primary database.
Key points of Logical standby are monitoring redo transport service and SQL apply service. As we know the troubleshooting or monitoring the logical standby can be performed various ways like referring to alert log, trace files or through EM or through DGMGRL(broker) and various views depending on the availability of tools and options.
Using the alert log content you cannot judge whether the logical standby SQL apply is working fine or not, because if for some reason the SQL apply process was killed at OS level and those changes are not visible from alert log file, Of course alert log is great source to check for monitoring the mining of log files and recovery progress. In my opinion the very first source to review is the alert log of logical standby and also primary database to review the current status or to check any errors now or prior to ensure there are no abnormal errors.
Now we will see how to monitor or troubleshoot the logical standby using several fixed and dictionary views. If you would like to know the brief status of the logical standby sql apply status, we can query "v$logstdby_state" this view provides consolidated information from views v$logstdby and v$logstdby_stats.
SQL> select * from v$logstdby_state;
PRIMARY_DBID PRIMARY_CON_DBID SESSION_ID REALTIME_APPLY STATE CON_ID
————— —————- ————— ————— ——– —————
3793852408 3793852408 1 Y IDLE 1
SQL>
If you see from the above output, it shows whether the Real-Time apply is enabled or not and also the current status of SQL apply which is "IDLE" it means SQL apply has applied all changes which ever caught up from primary database and if in case any transactions are writing actively and you can check the status as changing. For example below the state is "APPLYING".
SQL> select * from v$logstdby_state;
PRIMARY_DBID PRIMARY_CON_DBID SESSION_ID REALTIME_APPLY STATE CON_ID
————— —————- ————— ————— ——– —————
3793852408 3793852408 1 Y APPLYING 1
SQL>
If in case for long time the state is IDLE and no changes and if you want to ensure that the redo transport and SQL apply is working properly, then you can perform small test like below and review the views. First gather the maximum sequence of primary database and it's 83.
SQL> select max(sequence#) from v$archived_log;
MAX(SEQUENCE#)
————–
83
SQL>
Logical standby owns a very good dictionary view i.e. dba_logstdby_log which shows the information of the registered log files. So from logical standby the latest sequence of primary 83 shows on standby with the status as "APPLIED" and that mean logical standby is up to date with primary database.
SQL> select sequence#,first_change#,next_change#,timestamp,applied,blocks,block_size from dba_logstdby_log;
SEQUENCE# FIRST_CHANGE# NEXT_CHANGE# TIMESTAMP APPLIED BLOCKS BLOCK_SIZE
———- ————- ———— ——— ——– ———- ———-
76 2815207 2816929 30-JUN-15 YES 70842 512
77 2816929 2816948 30-JUN-15 YES 17 512
78 2816948 2817230 30-JUN-15 YES 163 512
79 2817230 2818492 30-JUN-15 YES 2033 512
80 2818492 2818591 30-JUN-15 YES 76 512
81 2818591 2819488 30-JUN-15 YES 520 512
82 2819488 2819957 30-JUN-15 YES 270 512
83 2819957 2820247 30-JUN-15 YES 354 512
8 rows selected.
SQL>
The above example is only determination but to ensure it we can enforce log switch on primary database and check whether the new generated sequence of primary is received on logical standby or not. From primary we have performed log switch and the latest sequence on primary is 85.
SQL> alter system switch logfile;
System altered.
SQL> /
System altered.
SQL> select max(sequence#) from v$archived_log;
MAX(SEQUENCE#)
————–
85
SQL>
Again we will use query dba_logstdby_log to monitor, if we see from below output it clears that sequence number 85 applied on standby.
SQL> select sequence#,first_change#,next_change#,timestamp,applied,blocks,block_size from dba_logstdby_log;
SEQUENCE# FIRST_CHANGE# NEXT_CHANGE# TIMESTAMP APPLIED BLOCKS BLOCK_SIZE
———- ————- ———— ——— ——– ———- ———-
76 2815207 2816929 30-JUN-15 YES 70842 512
77 2816929 2816948 30-JUN-15 YES 17 512
78 2816948 2817230 30-JUN-15 YES 163 512
79 2817230 2818492 30-JUN-15 YES 2033 512
80 2818492 2818591 30-JUN-15 YES 76 512
81 2818591 2819488 30-JUN-15 YES 520 512
82 2819488 2819957 30-JUN-15 YES 270 512
83 2819957 2820247 30-JUN-15 YES 354 512
84 2820247 2863222 01-JUL-15 YES 70895 512
85 2863222 2863229 01-JUL-15 YES 4 512
10 rows selected.
SQL>
The above query is specific to logical standby environment likewise we use v$managed_standby view in Physical standby database and also it can be used in Logical standby database for some extent to track the status of the processes.
SQL> select sequence#,process,pid,status,client_process,block#, active_agents, known_agents FROM gv$managed_standby ORDER BY thread#, pid;
SEQUENCE# PROCESS PID STATUS CLIENT_P BLOCK# ACTIVE_AGENTS KNOWN_AGENTS
———- ——— ———- ———— ——– ———- ————- ————
0 ARCH 26524 CONNECTED ARCH 0 0 0
0 RFS 27258 IDLE UNKNOWN 0 0 0
0 RFS 27260 IDLE UNKNOWN 0 0 0
0 RFS 27262 IDLE UNKNOWN 0 0 0
85 ARCH 26520 CLOSING ARCH 1 0 0
13 ARCH 26522 CLOSING ARCH 81920 0 0
84 ARCH 26526 CLOSING ARCH 69632 0 0
86 RFS 27254 IDLE LGWR 588 0 0
8 rows selected.
From the above small test we can confirm whether the transactions from primary is actively receiving and applying or not.
SQL Apply Process
Internally SQL apply process is divided into two parts i.e. Redo Mining and the Redo Apply. In this regards many of the processes will run background. Initially "READER" will reads the information from the standby redo log files and simultaneously "PREPARER" and "BUILDER" processes works in mining the redo and also the SQL apply processes will be running with other work processes such as "ANALYZER", "COORDINATOR" and "APPLIER" to apply changes to logical standby database. Using the view "v$logstdby_stats" we can check each statistics value. For example to check whether the coordinator is working or not, then we can track the status using this view.
SQL> select name,value from v$logstdby_stats where name='coordinator state';
NAME VALUE
—————————— ———-
coordinator state IDLE
SQL> /
NAME VALUE
—————————— ———-
coordinator state APPLYING
SQL>
To check the status of each process of redo mining and the sql apply, v$logstdby_prcess will helps to show the current status of the log apply services and the responsible sessions.
SQL> select sid,serial#,spid,type from v$logstdby_process;
SID SERIAL# SPID TYPE
———- ———- ———————— ——————————
21 29 27256 COORDINATOR
64 21 27394 ANALYZER
66 3 27398 APPLIER
68 1 27407 APPLIER
70 1 27409 APPLIER
72 1 27411 APPLIER
74 1 27413 APPLIER
46 31 27264 READER
58 17 27266 BUILDER
62 5 27268 PREPARER
10 rows selected.
SQL>
To know overall sql apply status with real time statistics we can merge views to extract the latest scn(highest SCN), applied scn on standby and the Read SCN(SCN that has been read and saved)
SQL> select a.latest_scn,a.latest_time,a.applied_scn,a.applied_time,b.read_scn,b.read_time from v$logstdby_progress a,dba_logstdby_progress b;
LATEST_SCN LATEST_TIME APPLIED_SCN APPLIED_TIME READ_SCN READ_TIME
————— ——————– ————— ——————– ————— ——————–
2867336 01-JUL-2015 15:20:23 2867331 01-JUL-2015 15:20:21 2867334 01-JUL-2015 15:20:22
SQL>
To verify the status of the log apply services which are currently running we can use another view v$logstdby but it is deprecated however still I can say it as useful view so that we can check each processes work currently running and which sequence is currently reading so on.
SQL> select type,status,high_scn from v$logstdby;
TYPE STATUS HIGH_SCN
————— ———————————————————— ————–
COORDINATOR ORA-16116: no work available 2864778
ANALYZER ORA-16116: no work available 2864499
APPLIER ORA-16116: no work available 2864491
APPLIER ORA-16116: no work available 2864499
APPLIER ORA-16116: no work available 2863087
APPLIER ORA-16116: no work available 2864472
APPLIER ORA-16116: no work available 2864480
READER ORA-16242: Processing log file (thread# 1, sequence# 86) 2864778
BUILDER ORA-16116: no work available 2864518
PREPARER ORA-16116: no work available 2864517
10 rows selected.
SQL>
We will walk through with one more view which shows the history on logical standby apply activity and also it can be used to check failures of the redo apply on logical standby databases, Especially the status column which gives key information regarding the current activity of the processes or the information why apply is stopped so on.
SQL> select event_time,commit_scn, current_scn,status from dba_logstdby_events order by event_time;
EVENT_TIM COMMIT_SCN CURRENT_SCN STATUS
——— ———- ———– ——————————————————————————–
30-JUN-15 ORA-16111: log mining and apply setting up
30-JUN-15 Apply LWM 2816936, HWM 2816936, SCN 2816936
30-JUN-15 ORA-16128: User initiated stop apply successfully completed
30-JUN-15 APPLY_UNSET: RECORD_SKIP_ERRORS
30-JUN-15 APPLY_UNSET: RECORD_APPLIED_DDL
30-JUN-15 APPLY_UNSET: RECORD_SKIP_DDL
30-JUN-15 APPLY_UNSET: RECORD_SKIP_ERRORS
30-JUN-15 APPLY_UNSET: MAX_SGA
30-JUN-15 APPLY_UNSET: RECORD_APPLIED_DDL
30-JUN-15 APPLY_UNSET: RECORD_SKIP_DDL
30-JUN-15 APPLY_UNSET: MAX_EVENTS_RECORDED
30-JUN-15 APPLY_UNSET: PRESERVE_COMMIT_ORDER
30-JUN-15 APPLY_UNSET: MAX_SERVERS
30-JUN-15 APPLY_UNSET: MAX_EVENTS_RECORDED
30-JUN-15 APPLY_UNSET: PRESERVE_COMMIT_ORDER
30-JUN-15 ORA-16111: log mining and apply setting up
30-JUN-15 Apply LWM 2816936, HWM 2816936, SCN 2816936
04-JUL-15 Shutdown acknowledged
04-JUL-15 ORA-16246: User initiated abort apply successfully completed
04-JUL-15 APPLY_UNSET: MAX_SERVERS
04-JUL-15 APPLY_UNSET: MAX_SGA
04-JUL-15 APPLY_UNSET: RECORD_APPLIED_DDL
04-JUL-15 APPLY_UNSET: RECORD_SKIP_DDL
04-JUL-15 APPLY_UNSET: RECORD_SKIP_ERRORS
04-JUL-15 APPLY_UNSET: PRESERVE_COMMIT_ORDER
04-JUL-15 APPLY_UNSET: MAX_EVENTS_RECORDED
04-JUL-15 APPLY_UNSET: RECORD_SKIP_DDL
04-JUL-15 APPLY_UNSET: RECORD_SKIP_ERRORS
04-JUL-15 APPLY_UNSET: PRESERVE_COMMIT_ORDER
04-JUL-15 APPLY_UNSET: MAX_EVENTS_RECORDED
04-JUL-15 APPLY_UNSET: RECORD_APPLIED_DDL
04-JUL-15 Apply LWM 3020638, HWM 3020638, SCN 3020827
04-JUL-15 ORA-16111: log mining and apply setting up
04-JUL-15 3054931 3054928 ORA-16226: DDL skipped due to lack of support
Apart from monitoring the Logical standby from SQL* Plus, we can also check the status of logical standby complete status like Apply Lag, Transport Lag.
DGMGRL> show database india;
Database – india
Role: LOGICAL STANDBY
Intended State: APPLY-ON
Transport Lag: 4 minutes 23 seconds (computed 11 seconds ago)
Apply Lag: 4 minutes 23 seconds (computed 11 seconds ago)
Apply Rate: 1.93 GByte/s
Instance(s):
drmcdb
Database Status:
SUCCESS
DGMGRL>
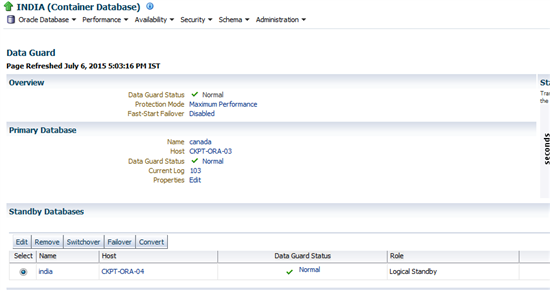
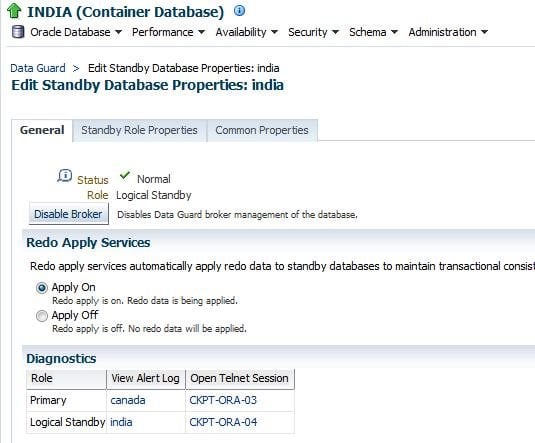
There is no surprise that EM also can monitor the logical standby but there are limitations with it. Of course still we can check the upper level status of the Data Guard configuration status, the Lag with the primary database and ability to alter the configuration with logical standby database such as changes in NET_TIMEOUT, DELAY_MINS so on.

Conclusion
We've seen how to monitor and troubleshoot the issue while working with logical standby database using much with SQL Plus and also finished touching using Broker and EM. We have also seen few key views/dictionary views in order to check the status of each work process during the redo mining and the apply status, to check the historical events recorded with logical standby and beautiful feature of to compare the Latest SCN, applied SCN and the Read SCN so that we can monitor how fast the transactions are recovering on logical standby database.

Start the discussion at forums.toadworld.com