
Why do you need a data preparation tool?
Most businesses have multiple sources of data and want to answer a wide variety of questions based on solid analysis. A data preparation tool is essential for formatting and focusing enterprise data for effective analysis. For a data preparation tool to be useful, it should perform these four key functions:
- Collect the data
- Cleanse the data
- Format the data
- Interpret the end result or answer the question
Understanding the question, need or result
Before undertaking any analysis, it’s important to first understand the question you’re trying to answer. In today's business intelligence world, the answer might reside in more than one data store or be revealed by understanding what is missing between two sets of data.
Always start each project asking, "What do I want as my end result?" Show an example of what you would like as an outcome, and detail the problem you are trying to solve. Then, a data analyst can help you figure out how to use a data preparation tool and available data for the best result.
Once you’ve answered this important question, you can turn to your data preparation tool to perform the key functions.
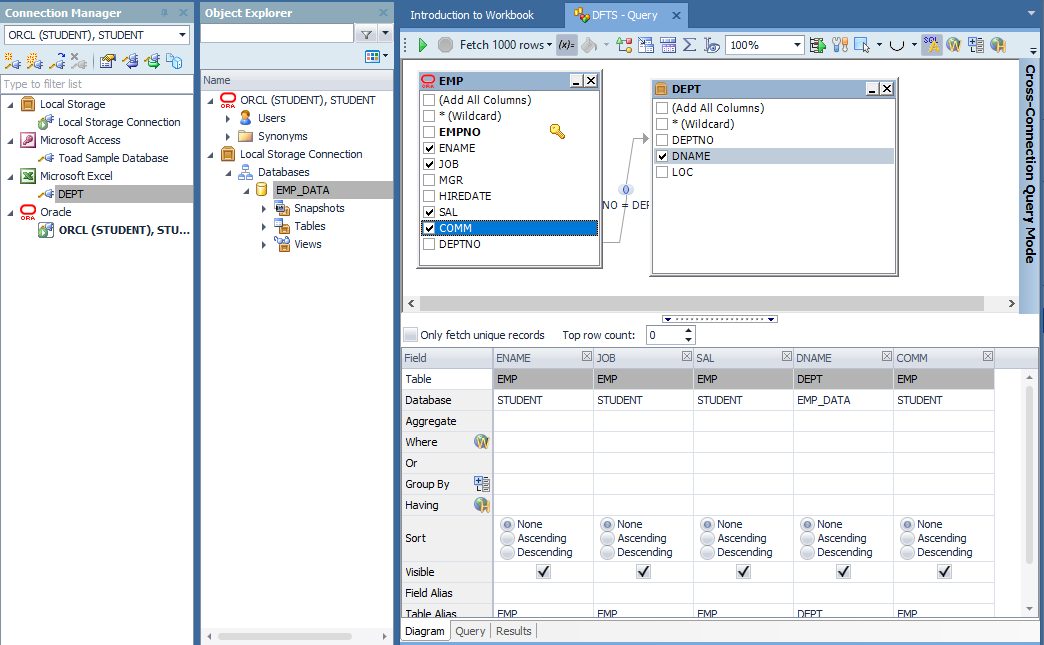
I'm using Query Builder here to illustrate using the EMP table from the Oracle connection and blending it with related data from the Local Storage connection. Notice the "Cross-Connection Query Mode" indicator along the right hand side of the Canvas.
I selected some columns for use and to give us something to prepare.
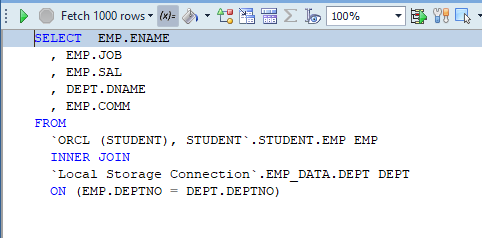
On the "Query" tab, notice the SQL generated is indeed across two different data stores. Only ANSI SQL is supported for Cross-Connection queries.
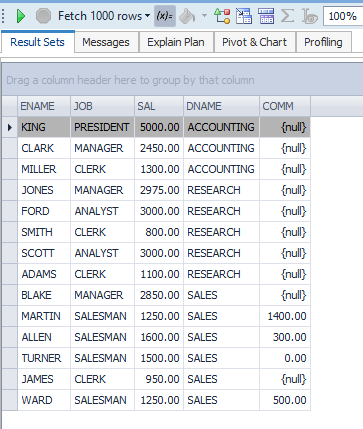
Click the green button to display some of the data. I find it helpful to see some of the data, which leads into the next two steps of data analysis: Cleanse and Format.
Cleanse the Data
To make sure the data is formatted correctly, it may be necessary to take some action to cleanse your data. Using the Toad Data Point data preparation tool, you can split columns, such as a phone number into area code and number, name fields into First Name, Last Name, etc. Transform and cleanse can also clean up existing data such as poorly-formatted email addresses, upper case/lower case issues and null values.
Notice in the above data display that there are some null values in the COMM (Commission) field. Null is nothing at all. It is not 0, it is not a blank. Technically, it is low values but from the business intelligence point of view, if you add something to null, you get null. So, these nulls need to be fixed before we can get to the format step, where we will add some math to simply the display of our data.
In this blog, I am working with the newer Workbook interface. These steps are also easily done using Traditional Toad Data Point.
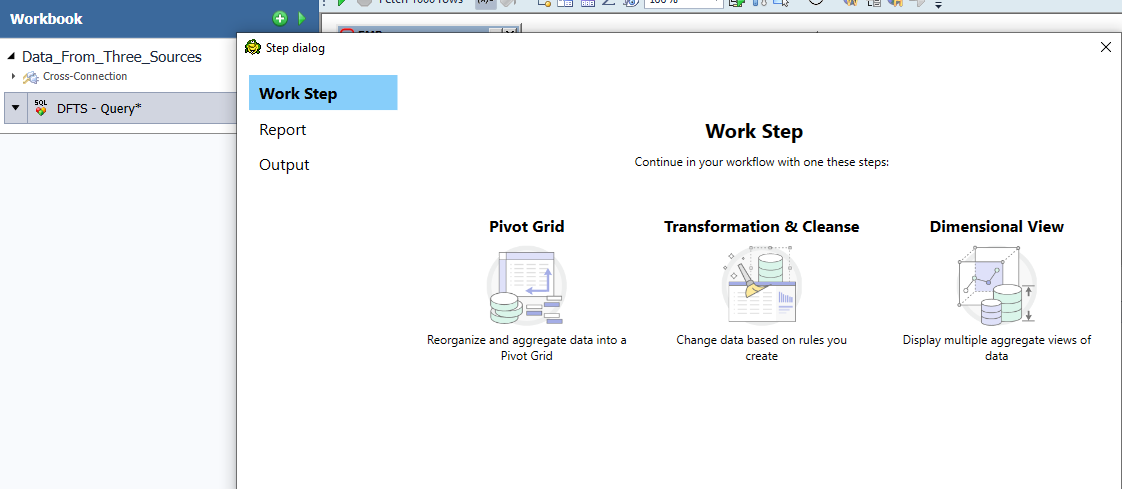
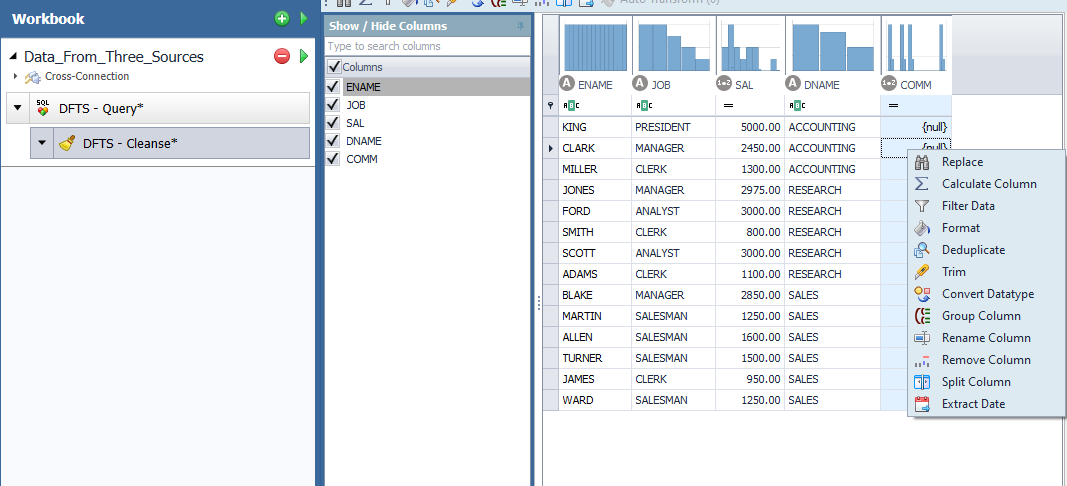
We want to fix the null values in our data set, and recreate this data set every time we run this workbook.
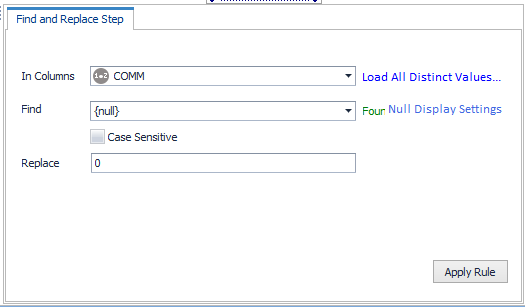
Toad Data Point allows for nulls to be found and replaced with something else such as a 0. You can use this feature to fix a broad range of data.
Toad Data Point can be used to include a null value function right in the SQL as well. Another method to carry out the same end result (correct math when null values are present) is to put this null value function right in the calculation for the total field.
This illustrates a good technique using features available in Toad Data Point that a non-SQL experienced person could easily do.
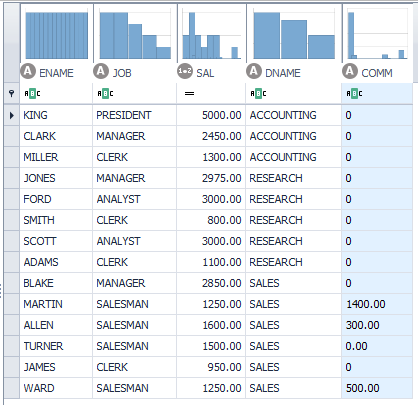
Toad Data Point can also transform and cleanse data. Through the use of this data preparation tool, the nulls are gone and have been substituted with 0 for all following steps in the workflow.
We can use this workflow to save the scrubbed data set for use in other analyses, and it can easily be shared with the rest of the department so they don't have to perform the same steps.
In fact, if there is data that can be transformed and formatted, this can happen separately and be used to securely save and share data sets with others.
Format the Data
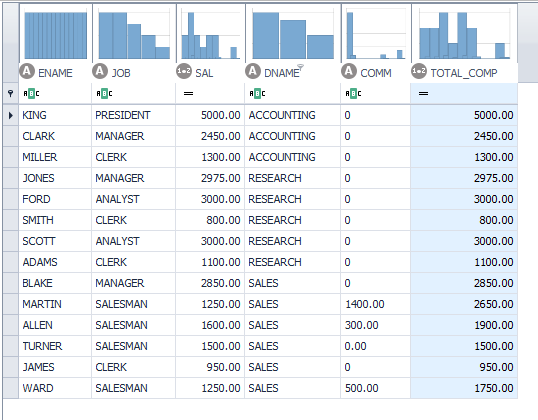
For this example, it would be helpful if there were a 'Total_Compensation’ or ‘Total_Comp' field that did the math for us. Perhaps the math you need is more challenging than just simple addition. However, this process saves a lot of time when data reporting is needed and quite possibly eliminates the chance of errors in the calculation process.
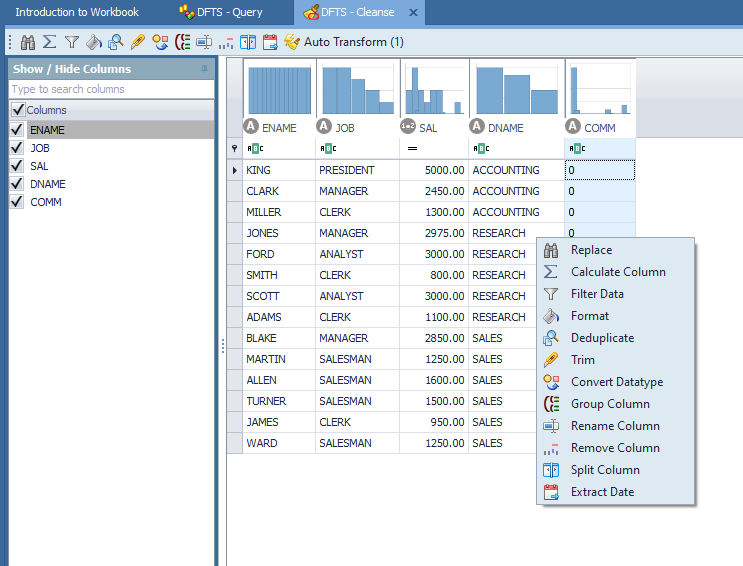
Select the 'Calculate Column' button or menu item. To see the menu, right click on a column on the canvas.
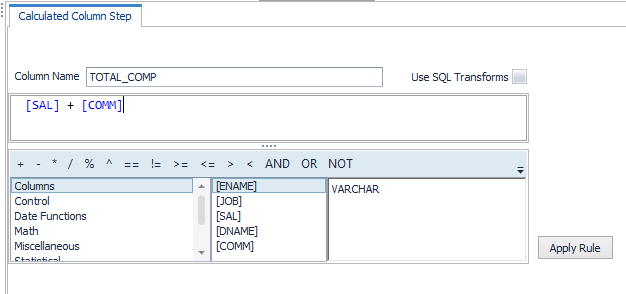
Make sure “Columns” is selected. The other selections are for various other functions. You have the items above to do the math.
Tip: If the column names do not appear, the panel is not wide enough. Drag it wider and this middle column will appear.
When done, click on 'Apply Rule'.
Interpret the end result/answer the question
You have the data organized, cleansed and formatted. What’s next?
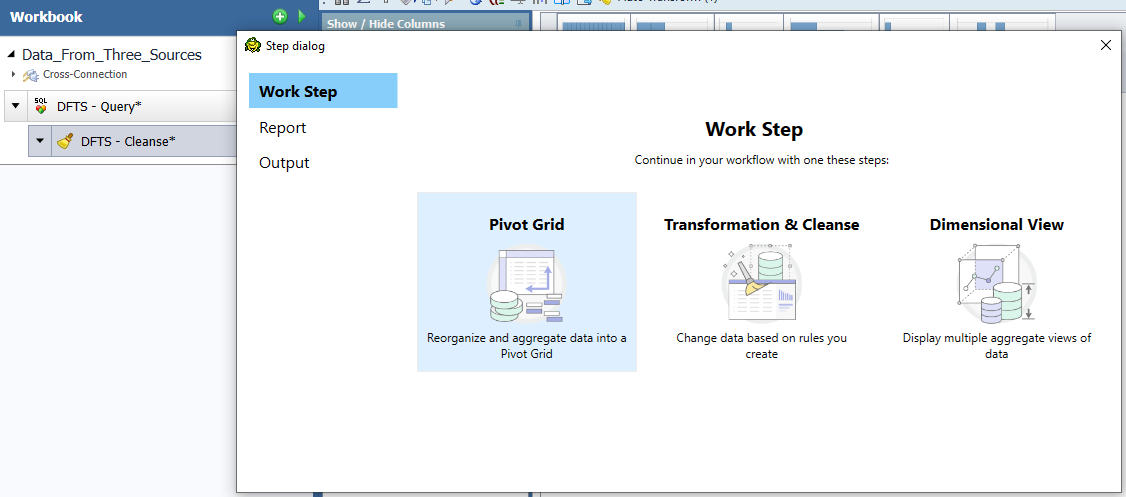
You can use a pivot grid to display data for interpretation.
Dimensional Views allows for similar data to be displayed and filtered, much like a dashboard.
Dimensional Views help ensure you have the correct data and can supplement your conclusions with actual data organized and related to other data, such as the data pivots in your pivot grid.
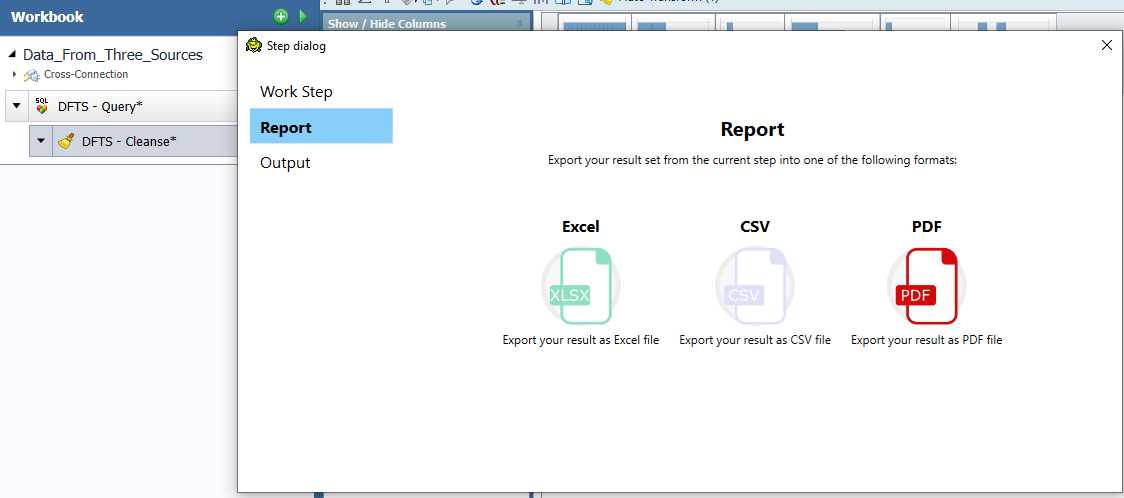
You can also report on your data. If you use the 'Add Step' from a pivot grid, you can save the output in an Excel Pivot Grid.
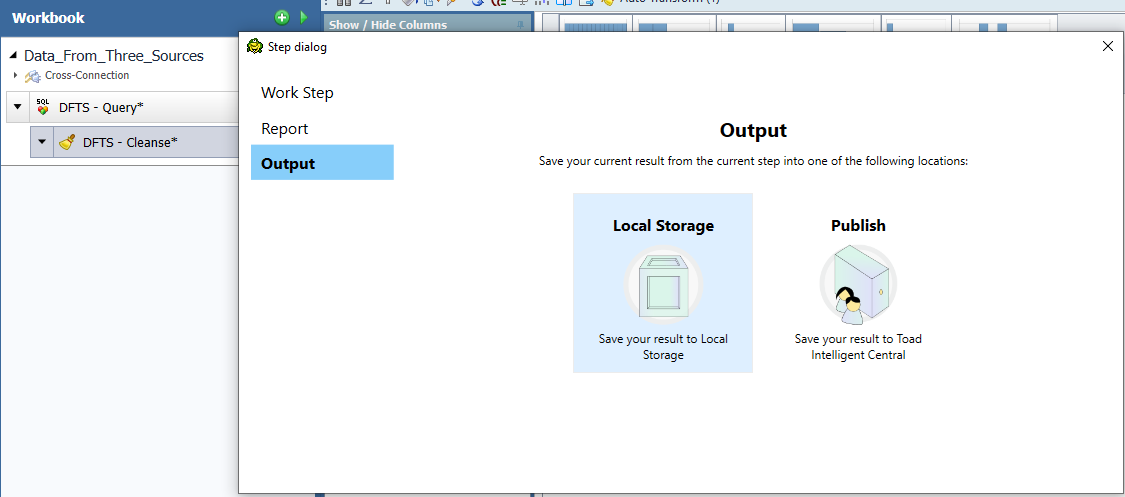
You can also save your collected, cleansed, and formatted data to Local Storage for future analysis, or share it via Publish with other members of your department using Toad Intelligence Central.
For a data preparation tool to be useful to analysts, it should minimally be able to collect data, cleanse and format, as well as create an easy report for interpretation. When used correctly, data preparation tools make it much easier for analysts to evaluate data and offer insight into various business decisions.
Try Toad Data Point for freeLearn how Toad Data Point can help you access and prepare data faster. Seamlessly access more than 50 data sources—both on premises and in the cloud—and switch between these data source with near zero transition times. Get started with our free 30-day trial. Already in a trial? If Toad Data Point is helping you connect, query and prepare data for faster business insights, buy it now or contact a sales representative. |
Toad Data Point is a serious data analysis tool that allows business analysts to easily collect and organize data from multiple data stores, clean up the data and format it, then use it for in-depth analysis to solve nearly any business question.

Start the discussion at forums.toadworld.com