Is your DB performance slow? Database health is all about visibility, stability, automation, alerts and diagnostics. Learn how in this blog.

The Quest® Toad® for Oracle Professional DB Admin Subscription edition has 6 benefits for DBAs as they maintain database health and stability. This blog focus on these benefits:
- Increase visibility across your database environment
- Maintain database health and stability
- Automate everyday database management tasks
- Get real-time alerts about critical events
- Quickly diagnose issues
- Optimize database performance
Increase visibility across your database environment
The Toad for Oracle Professional DB Admin Subscription edition allows you to easily see and manage your database environments, with areas for viewing exactly what each user is doing, top SQL-consuming database resources, and charts and graphs of the Oracle Automated Workload Repository.
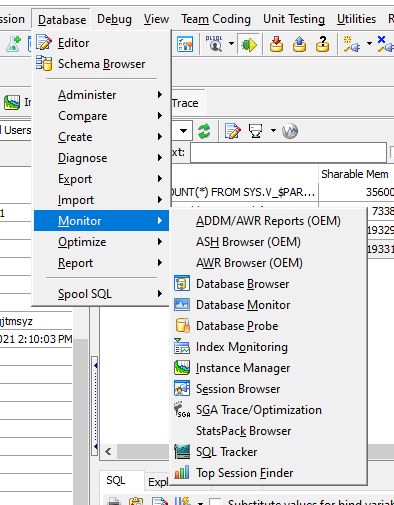
Visibility within Toad for Oracle Professional DB Admin Subscription edition
The above monitors easily allow you to stay on top of any database issue. Notice easy access to the Active Session History (ASH Browser) and the AWR Browsers.
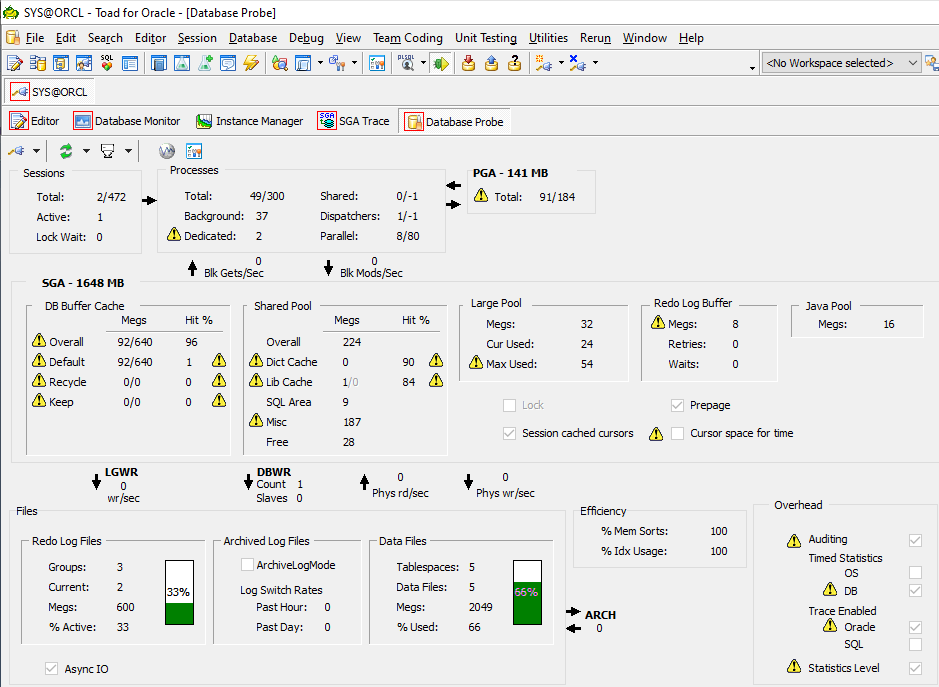
Database Probe
The Database Probe gives you a quick view of database health at any moment. Hover your mouse over the caution symbols to get more information about the indicators.
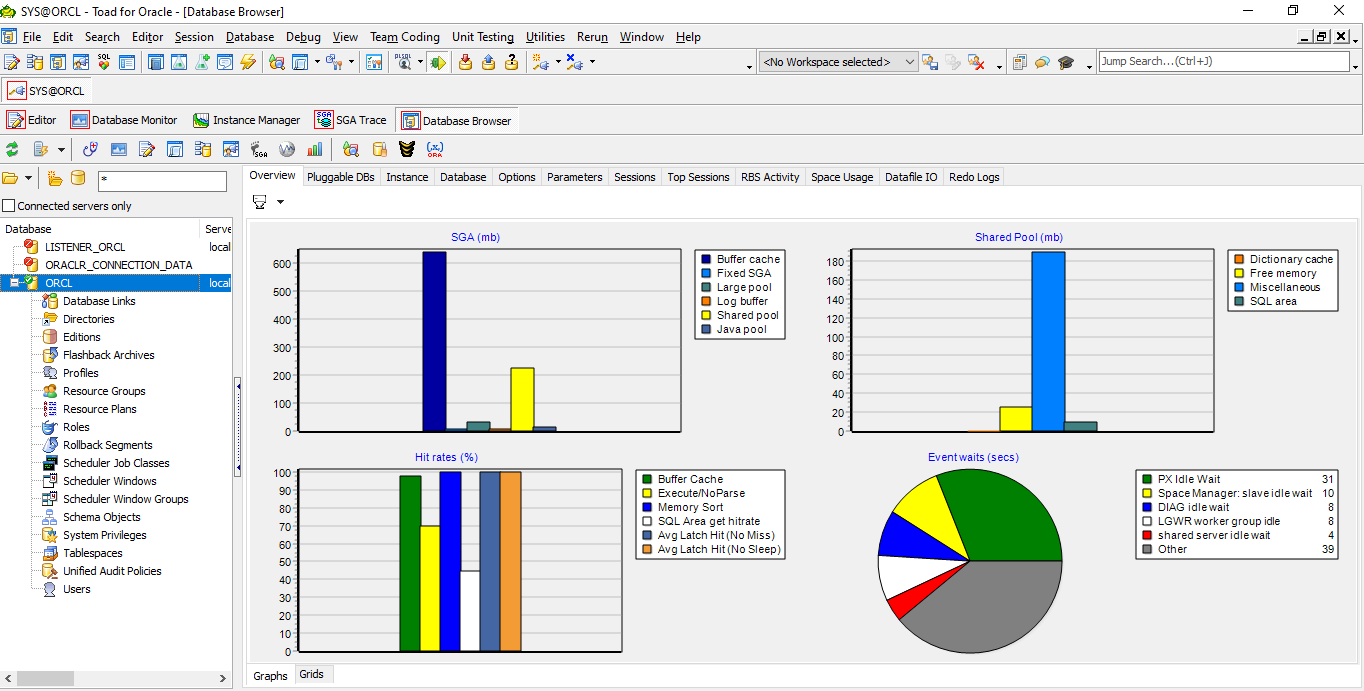 Database Browser
The Database Browser gives a quick view of database activity and overall database performance and stability.
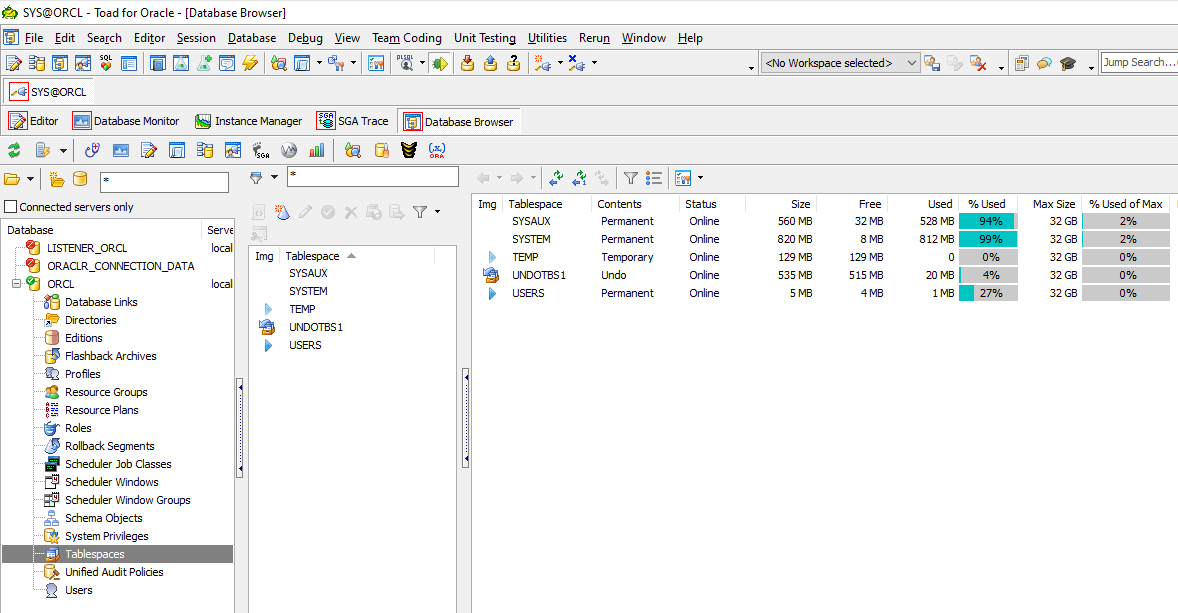 Database Browser tablespace capacity
This panel shows the tablespaces, their status, and most importantly, their percentage used. Filling a tablespace is a real application show-stopper.
Database Browser tablespaces
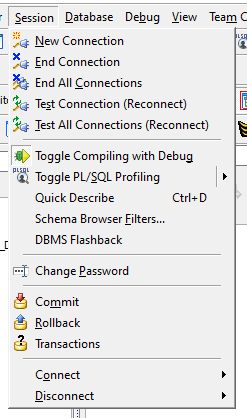
Toad for Oracle Professional DB Admin Subscription edition allows you to interact with the Oracle DBMS Flashback, or, gives you the ability to roll the database back to a point in time. Perhaps a user errantly dropped an important table – with this feature, you can quickly correct that error without spending the time to find the exact syntax to do so.
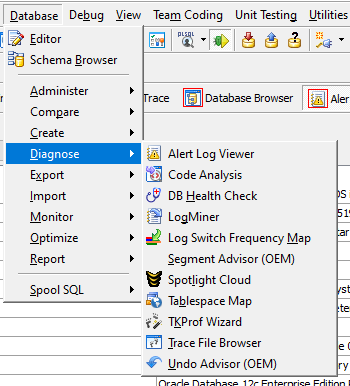
Diagnose –> Alert Log Viewer
The product allows you to easily view any database alert log. Monitoring this alert long allows the DBA to stay on top of any potential database problem, thus greatly improving database stability. The DB Health Check also monitors the alert log and can report on new activity.
Maintain database health and stability
Toad for Oracle Professional DB Admin Subscription edition has a 120-point Database Health Check. This feature can be run across any number of databases and can also send alerts for any problem found. I have written a separate blog post on this entire topic.
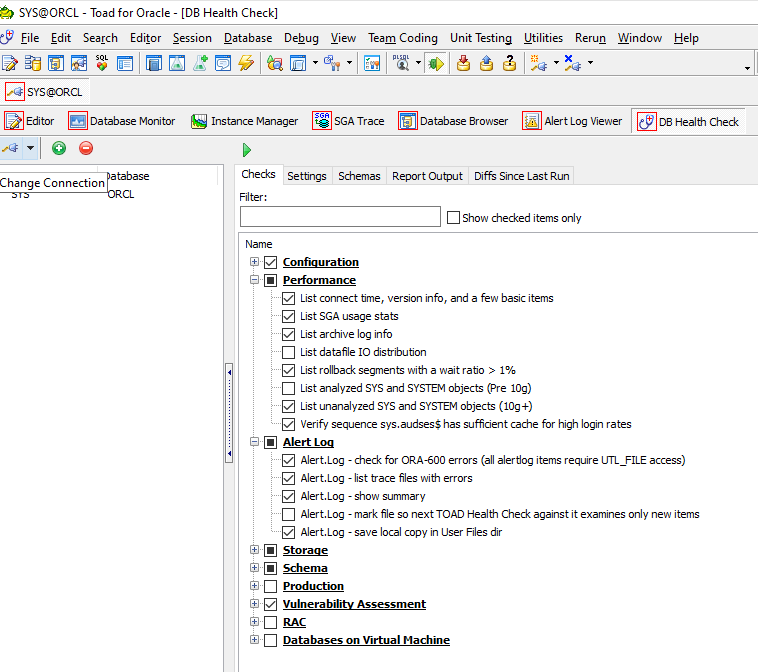 Toad for Oracle Database Health Check
To access this feature, click on Database –> Diagnose –> DB Health Check
Automate everyday database management tasks
Toad for Oracle has an excellent automation feature for scheduling any series of tasks, including your own scripts and other non-database programs.
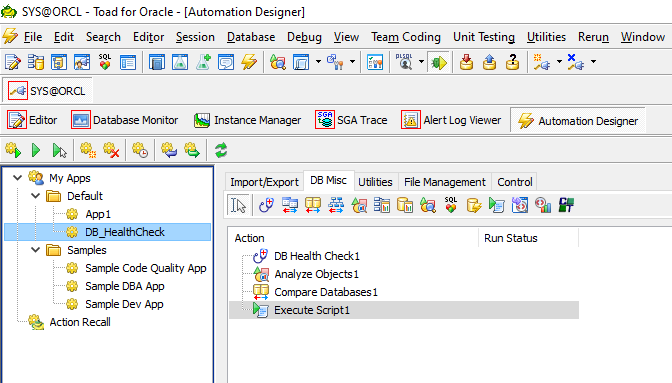 Toad for Oracle Automation Designer
The Toad for Oracle Professional DB Admin Subscription edition has a series of common DBA activities included in the Automation Designer. It’s accessed via a button on the tool bar (lightning bolt) or menu item Utilities –> Automation Designer.
In this example, I double-clicked on several of the icons along the right to show how easy it is to build a script to run the DB Health Check, Analyze Objects, Compare and Sync Databases, Compare and Sync Database Schemas, and execute a script I wrote. Each of these steps has its own property sheet for details for the task at hand. On the left, you can manage these automation scripts, create new ones and schedule them to run unattended.
Get real-time alerts about critical events
The Database Probe feature allows for real-time alerts. To access this feature, use the menu bar item Database –> Monitor –> Database Probe. This feature monitors quite a few of the DB Health Check items in real-time. This type of monitoring allows problems to be discovered quickly.
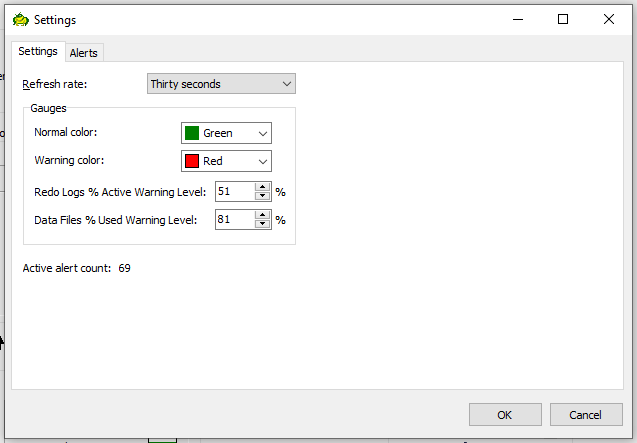
Toad for Oracle Database Probe options settings tab
This panel allows for changing the alert colors and adjusting the display of the percentages used of the redo and data files. This feature alone greatly assists with database stability.
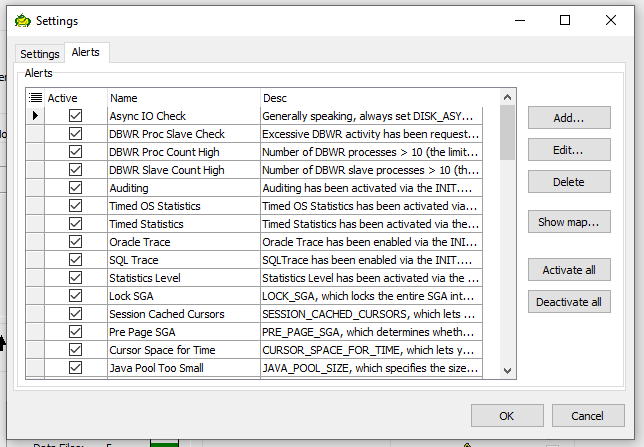
Toad for Oracle Database Probe options alerts tab
This panel allows for any of the monitored metrics to be adjusted, deactivated, activated and managed. The 'Show Map' button allows you to quickly see each item’s current setting and where it appears on the Database Probe screen.
Quickly diagnose issues
I recommend the Session Browser to quickly diagnose any application issues.
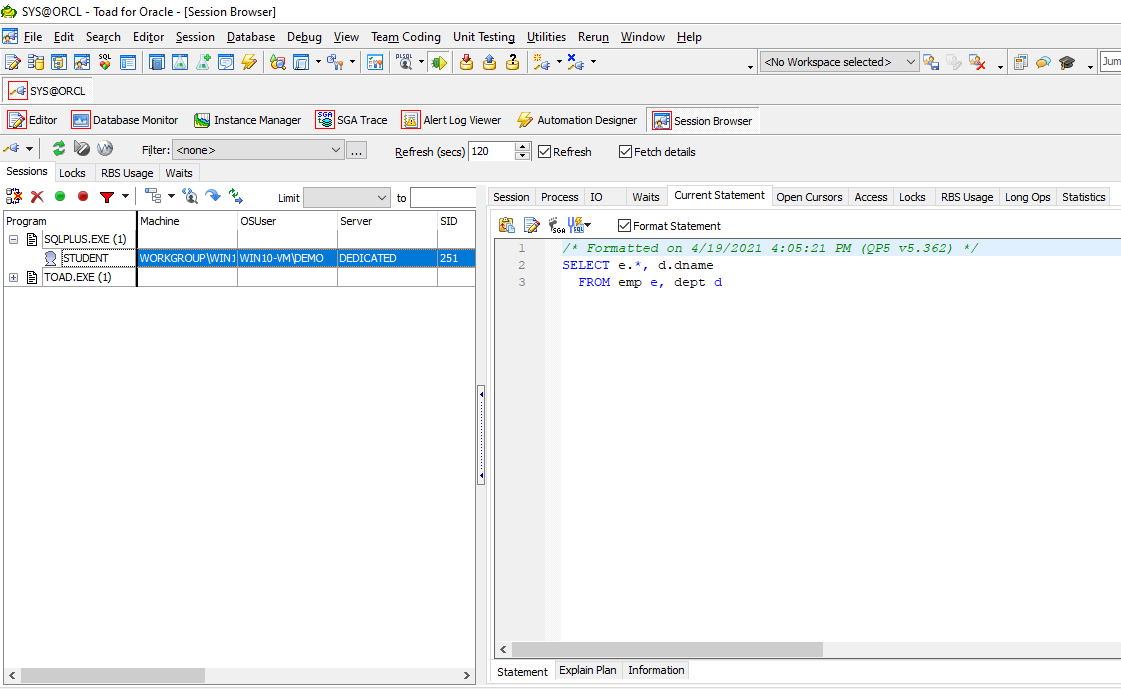 Toad for Oracle Session Browser
This feature is accessed by a button on the tool bar or by the menu item Database –> Monitor –> Session Browser. The Session Browser allows anyone with the proper privileges to instantly see what a particular user is running, if their SQL has a blocking lock, see how long that SQL has been running, see their SQL history, and more.
The Session Browser can see all the users connected to a particular instance of the database. This feature allows for a SQL trace to be turned on/off for a particular user, kill a user session and see any database metric that a user’s SQL has consumed. These columns are sortable just by clicking on them so jumping to the problem SQL is a snap.
Get Toad for Oracle Base Subscription todaySubscription / eStore: buy up to 10 licenses at a time, get auto update, support, announcements/invites to education. Talk to our professionals: demos, custom solutions, volume discounts. Not ready to buy? Get Toad for Oracle a 3rd way … try it free for 30 days. |
Optimize Database performance
Toad for Oracle Professional DB Admin Subscription edition has a complete set of utilities for discovering, diagnosing and solving just about every SQL issue. The SGA Trace feature allows for all SQL in the SGA to be viewed. Like the session browser, this SQL can quickly be sorted by elapsed time (for example) to bubble to the top the long-running SQL on any particular database.
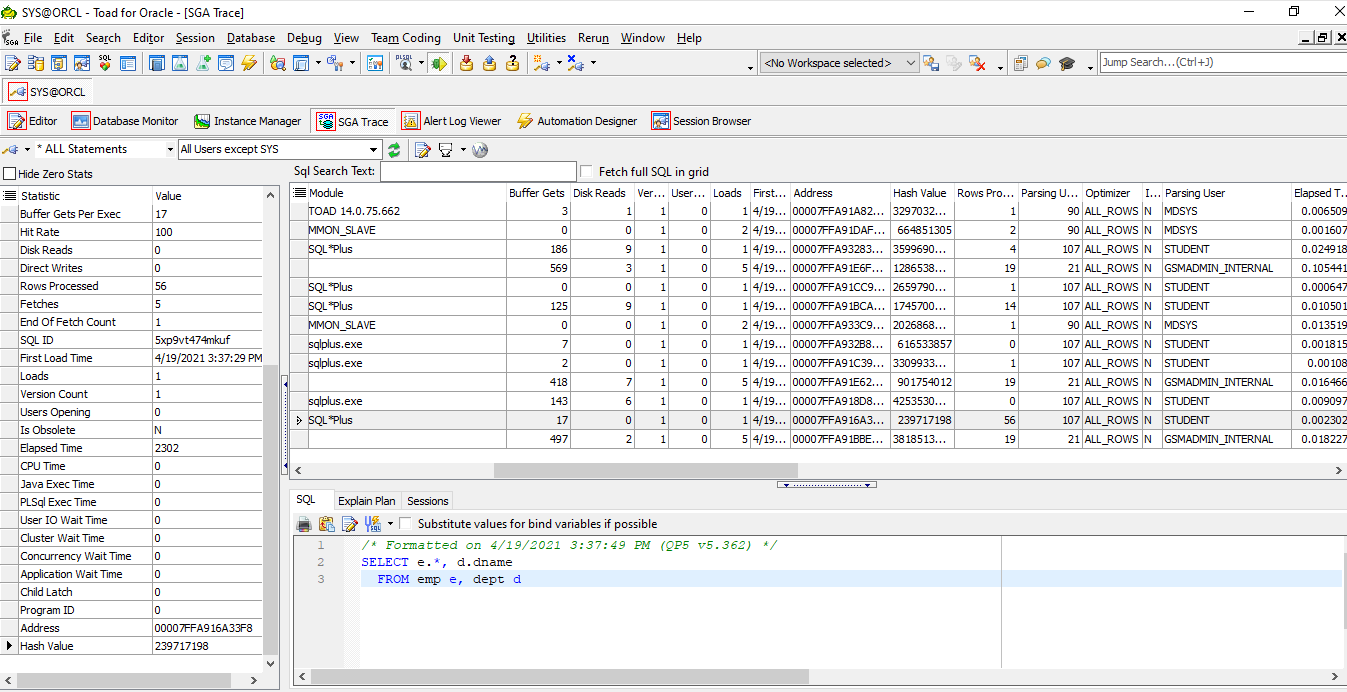 Toad for Oracle SGA trace
This information is similar to that found in the Session Browser but encompasses all the SQL, not broken out by a particular user and application as the Session Browser does. Again, you can see the SQL, get an explain plan, see the program that is running the SQL, the user, and database metrics associated with SQL. You can also show all of the Dictionary SQL if you desire.
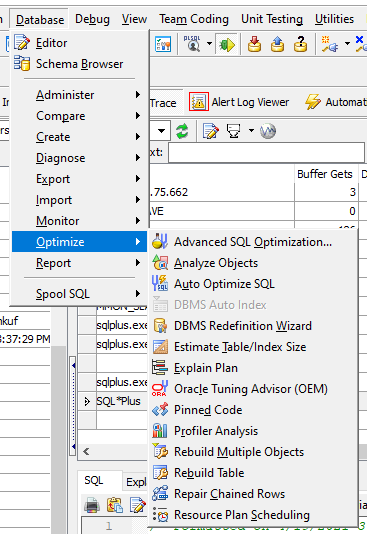
Toad for Oracle SQL optimization tools
Watch a video demo of a database health check
Closing
The Toad for Oracle Professional DB Admin Subscription edition is rich with features that assist DBAs with ensuring database stability. We’ve focused on 6 benefits from features that monitor database health, automate tasks, provide alerts and contribute to overall database performance.
Related information:
Blog: DB performance: 120-point database health check across multiple databases
Blog: Toad for Oracle – DB Health Check
Data Sheet: Toad for Oracle DB Admin Module
Dan Hotka has several course offeringsthat use Toad and Toad Data Point.
Help your colleagues
If you think your colleagues would benefit from this blog, share it now on social media with the buttons located at the top of this blog post. Thanks!


Start the discussion at forums.toadworld.com