Sluggish database? Not sure what’s wrong, or even how to fix it? Database power and flexibility is more important now, than ever. As your data increases in volume, your ability to store and process that data quickly and efficiently is paramount. Being nimble and adaptable is also of importance. In this blog, I’ll review eight areas where Toad for Oracle Database Admin Module enables you to:
- Monitor and optimize database performance
- Gain visibility into database health
- Quickly compare and deploy changes
- Easily diagnose issues
- Analyze all your database objects
- Simplify data management
- Streamline change management
- Get real-time alerts
The Database Admin Module is a separately licensed set of features within the Toad for Oracle suite. It’s also available in these Toad for Oracle editions: Toad for Oracle Pro DB Admin subscription and Toad for Oracle DBA Edition and higher.
Monitor and optimize database performance
The Toad for Oracle DB Admin Module has cool monitoring visuals built right into it. These visuals allow you to spot problem areas so you can stay on top of your database stability and visualize your database power.
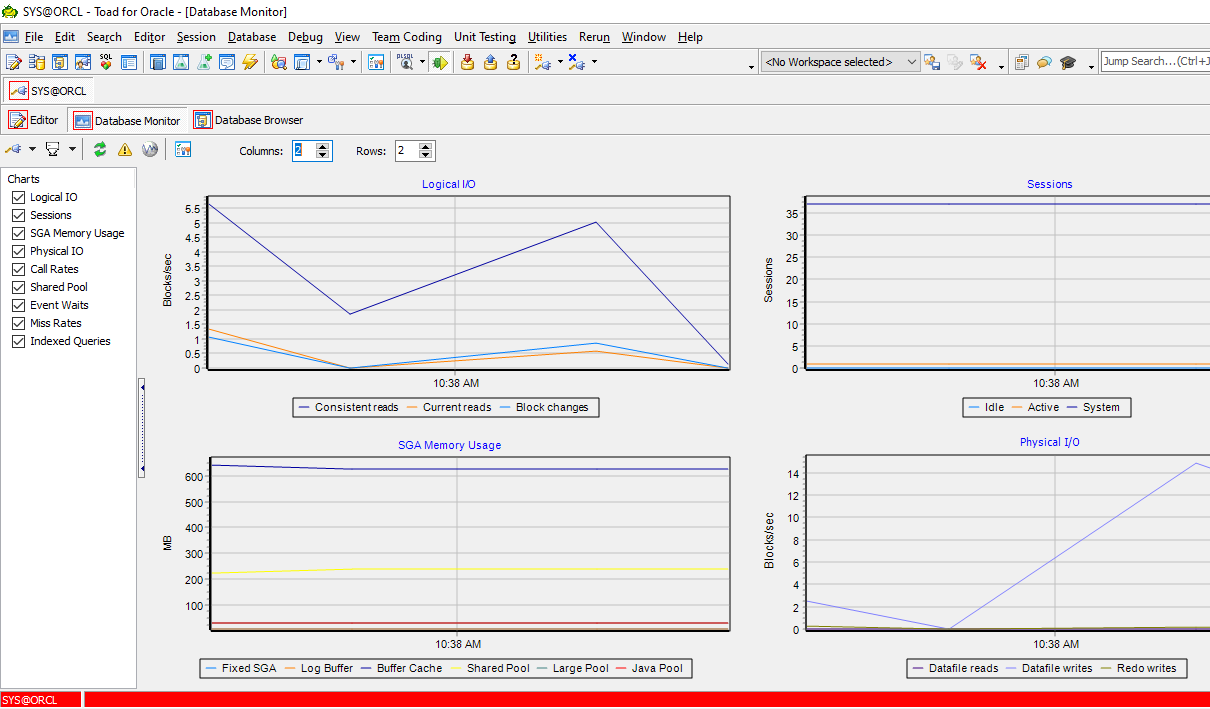
Visualize your database power with these graphs and charts in Toad for Oracle Database Monitor.
The Database Monitor (menu item Database –> Monitor –> Database Monitor) shows a variety of hit ratios, logical and physical I/O activity, session activity, and even query performance using indexes.
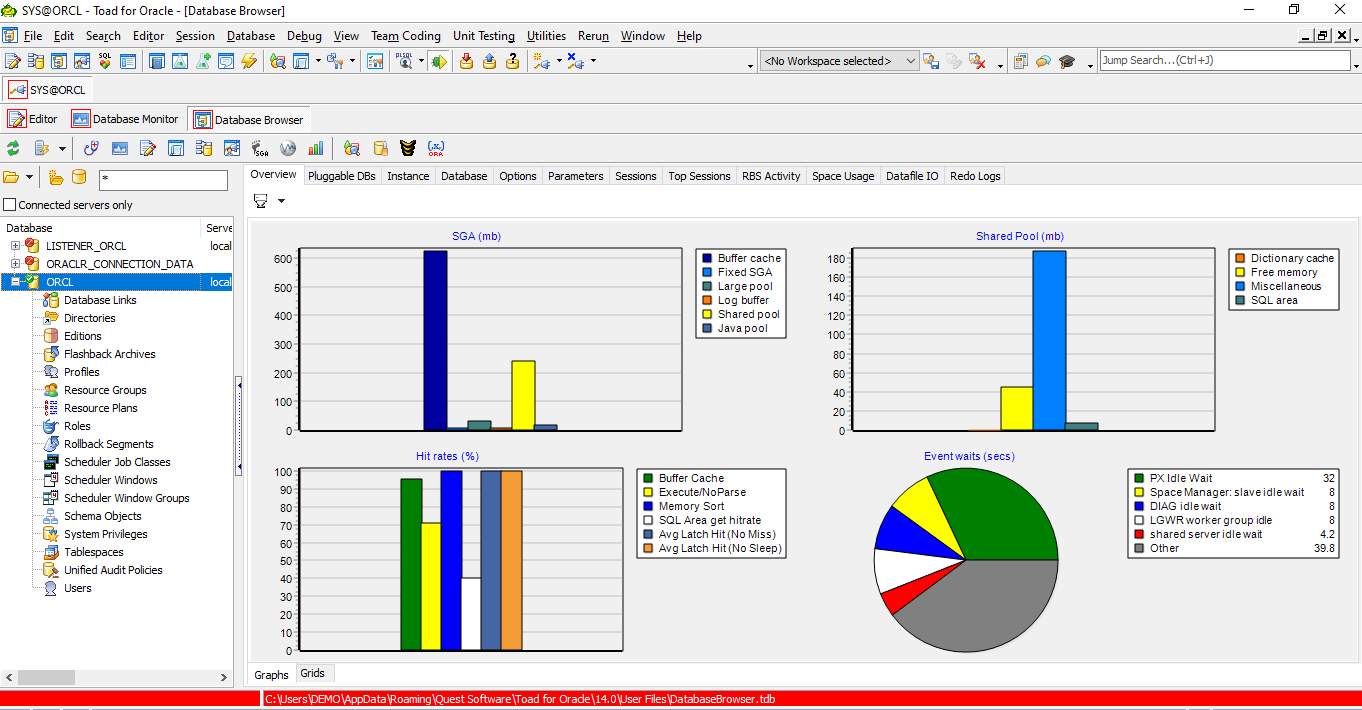
Toad for Oracle Database Browser
The Database Browser (menu item Database –> Monitor –> Database Browser) shows database resource activity. The Database Browser allows you to drill into any of these items visible in the tree browser on the left to fix or furthur monitor database needs for better database stability.
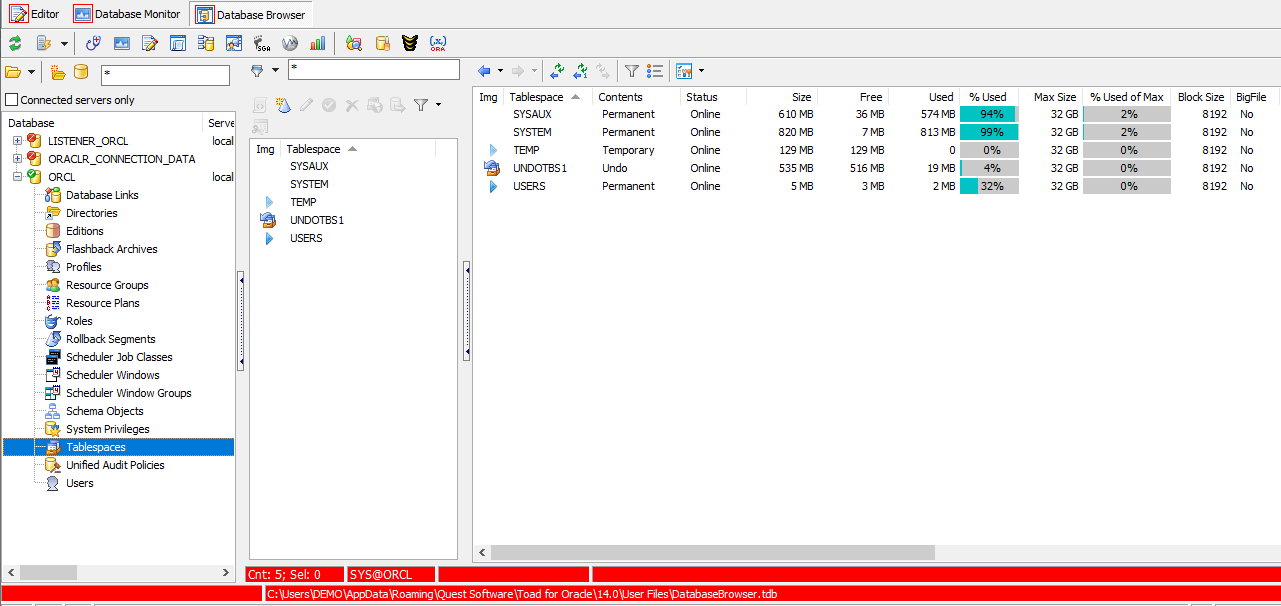
Toad for Oracle Database Browser Tablespace options
For example, clicking on the Tablespaces in the tree browser you can see each tablespace, their status, and how full they might be. The Edit button on this panels tool bar allows you to add additional space easily if needed.
This information, combined with that of the Database Monitor allows you to stay on top of your database power.
Gain visibility into database health
The Database Health Check has a 120-point health check you can easily run across multiple databases. You can also have this report emailed to you on a regular basisand you can have this feature compare the current report to the prior report and just report on the differences.
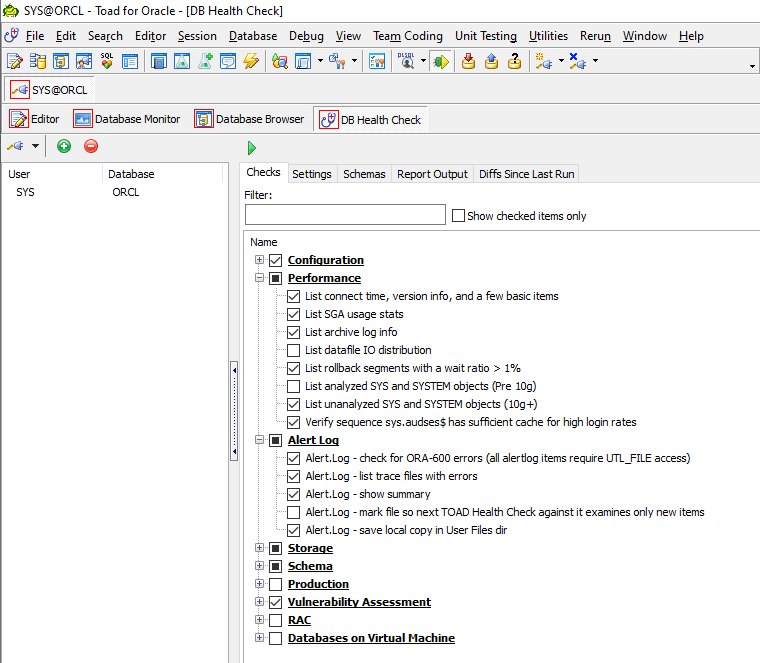
Toad for Oracle Database Health Check
This feature is accessed via the menu bar Database –> Diagnose –> DB Health Check.
In the coming weeks, I’m going to take a deep dive and explore this feature more thoroughly. In the meantime, this video walks you through the basics.
Quickly compare and deploy changes
This feature is major cool to keep your development database in sync with production and to migrate application changes from either test or development to production. Catching all of the changes in a single script, insures all changes will be migrated insuring database stability during implementing changes.
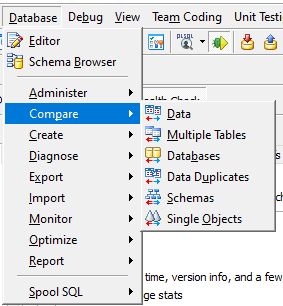
Toad for Oracle Compare features
Notice you can compare just data, multiple tables, entire databases, look for duplicate data, anything in a schema, or individual objects.
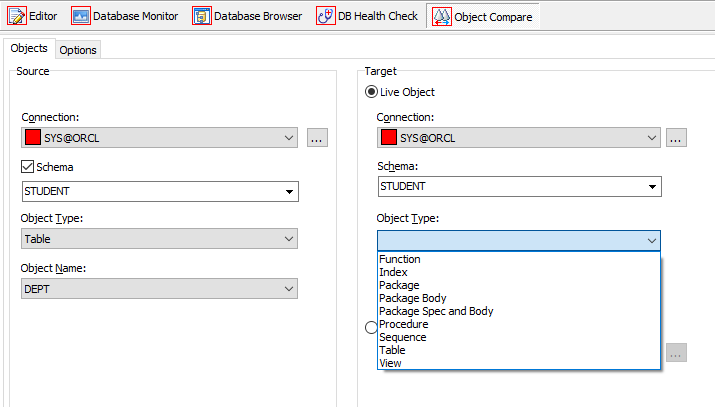
Toad for Oracle Object Compare options
Each of these compare options allow you to be very flexible with what you are comparing and syncing back up.
Each of these features also produces a script that will synchronize the environment. This feature allows you to increase your database power by eliminating any missed items or mistakes in syntax.
You can also automate these compare features. This is convenient to keep a development or test environment current with that in production.
Easily diagnose issues
The DB Admin Module gives you access to the Alert Log Viewer. Toad for Oracle also has nice views into StatsPack (a yesteryear statistics monitor) and today’s Automatic Workload Repository. Access this feature by the menu item Database –> Diagnose –> Alert Log Viewer.
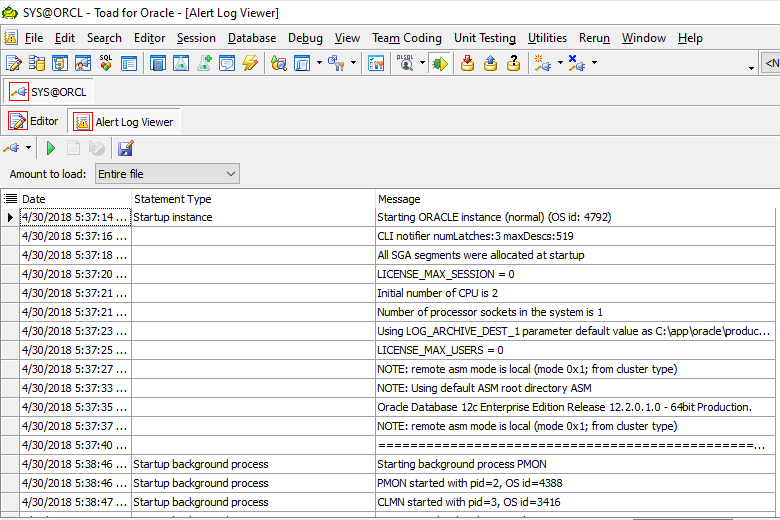
Toad for Oracle Alert Log Viewer
This alert log allows for easily seeing any current issues within the database. This screen view shows the database starting up showing the version of Oracle, key licensed features of that Oracle RDBMS, along with the timings.
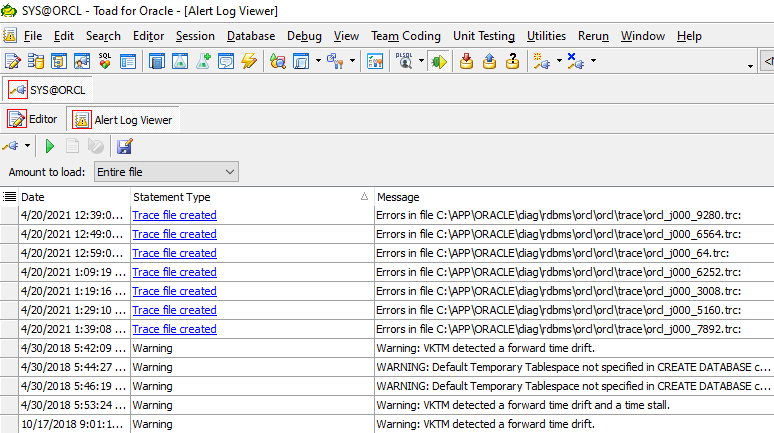
Toad for Oracle Alert Log Viewer by Statement Type
Clicking on the headings sorts the logs into the order of that column. This illustration shows a click on the “statement type” heading, sorting the alerts into order by type. This will allow the DBA to quickly see any problem alerts, such as the nasty Ora-600 errors.
In the near future, I’m going to take a deep dive with the DB Health Check, specifically how to quickly diagnose issues.
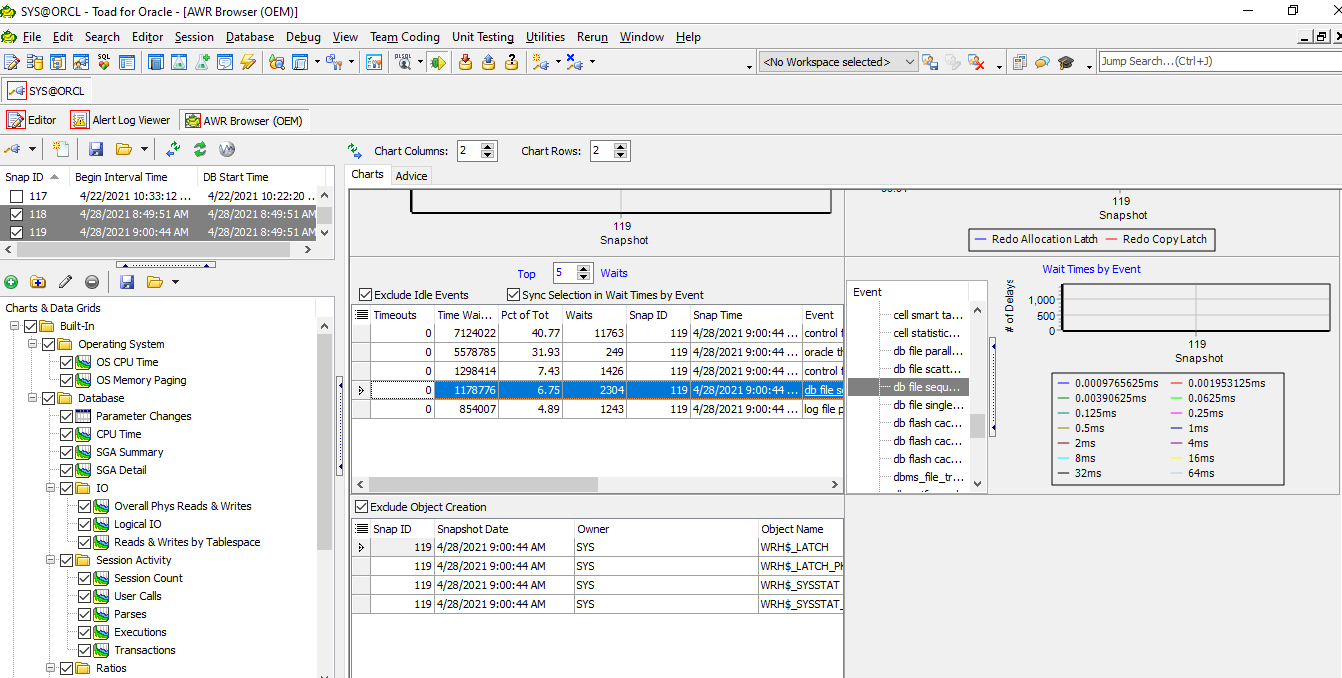
Toad for Oracle AWR Browser
The AWR Browser allows the DBA to quickly compare one time position in the database to another. This information is valuable when trying to diagnose database or application issues that occurred at a specific time. Notice the display shows both the operating system statistics along with useful wait events (at the bottom).
This feature is accessed from the menu bar Database –> Monitor –> AWR Brower.
AWR has Oracle licensing requirements so make sure your database is covered under your Oracle agreement prior to reviewing any AWR data. IF you don’t have access to the AWR information, then the old StatsPack is still a great option, it gives similar information, and is accessed via the menu bar Database –> Monitor –> StatsPack Browser.
Analyze all your database objects
The Oracle RDBMS has been using the Cost-based Optimizer to build SQL explain plans since Oracle8. So, all database objects should have current statistics so that the SQL is performing at its optimal ability. Using the menu item Database –> Optimize –> Analyze Objects allows the DBA to monitor and collect statistics on most any or all database objects.
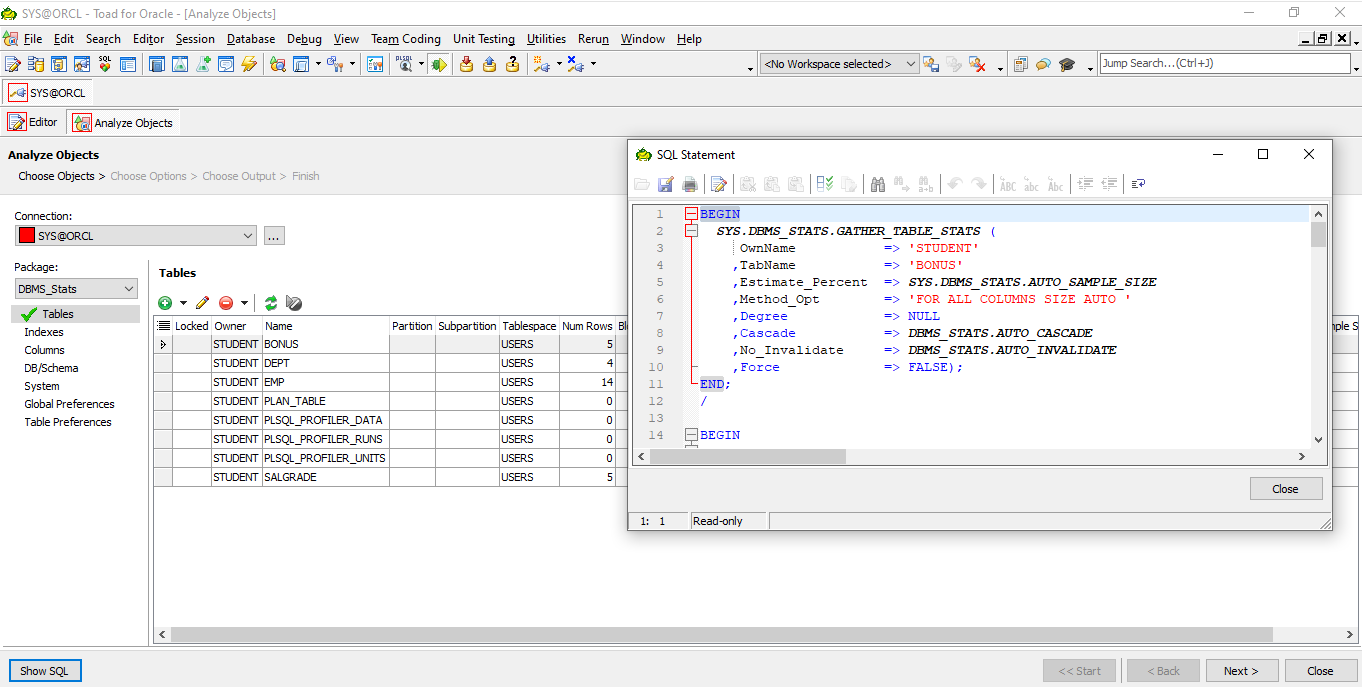
Toad for Oracle Analyze Objects
This view is of the application user “Student” and showing the tables owned by that schema. The SQL Statement box is visible by clicking the Show SQL button in the lower left. This panel is actually a wizard that will allow the DBA to not only see the statistics but change the statistics, collect fresh statistics, and set a variety of these options visible in the show SQL box.
Depending on the login user (SYS or SYSTEM), statistics can be collected on any database object. Statistics can also be copied (maybe useful in a test environment) and edited (there isn’t disk space for 10 million rows but you would like the statistics to reflect 10 million rows).
Simplify data management
Toad allows for the import and export of data between MS Office products such as Excel.
The DB Admin Module allows for data to be imported from dump files! Use the menu item Database –> Import –> Data Pump Import to import from backup dump files. This feature can import data from most any source too.
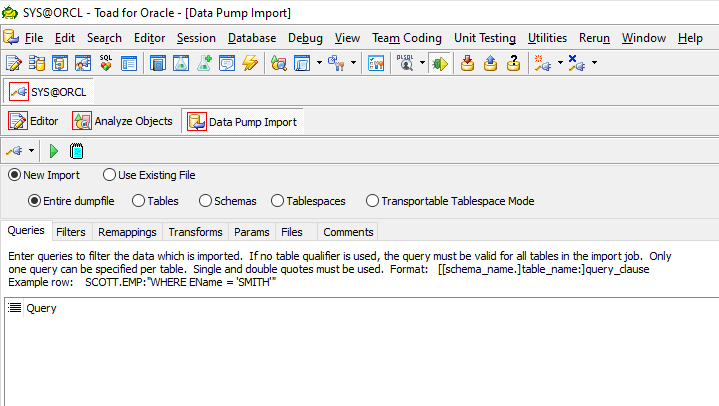
Data Pump Import Wizard
Notice in this panel/wizard that one can import a variety of different objects from backup dump files. The DBA can decide what exactly is needed to restore or to bring into a test environment. The Datapump Export (menu item Database –> Export –> Data Pump Export) allows for the same items to be easily selected for backup out of the database.
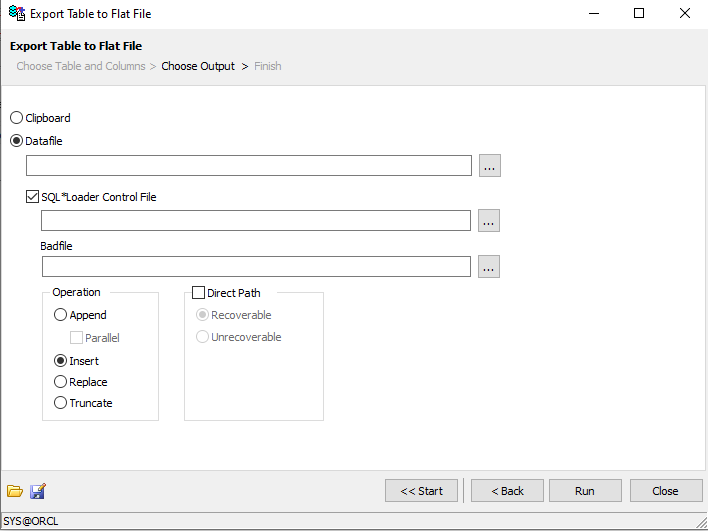
Export Table to Flat File
The Database Admin Module also allows for any object or set of objects to be exported to a flat file. The output can be insert statements or even a SQL Loader control file. The control file option allows for direct path loading, an extremely fast Oracle database option.
Streamline change management
Toad for Oracle allows for the export of just about anything from within the database. Toad for Oracle builds scripts and can format the data as well to as little as a simple table, an entire schema, or the entire database.
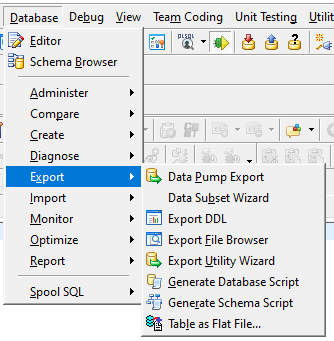
Generate Script Features
This illustration shows that several various scripts can be created.
The Export DDL does just that. It will create the DDL that is in the database making changes to a test environment easy to move to a production database.
The Generate Database Script and Generate Schema Script allows for very specific schema objects and permissions to be generated into a file.
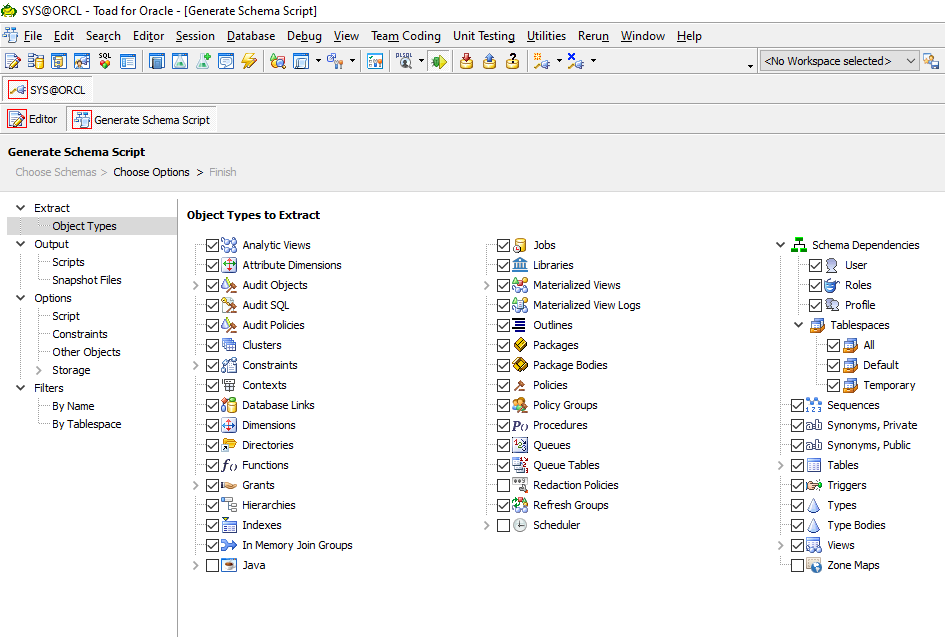
Generate DDL Options
This panel shows the 2nd page of the Generate Script wizard that allows the user to select exactly what they wish to see in the created DDL scripts.
Get real-time alerts
The DB Admin Module allows the DBA to see real-time alerts across the database. These alerts can be adjusted and others can be added. This feature is accessed via the menu item Database –> Monitor –> Database Probe.
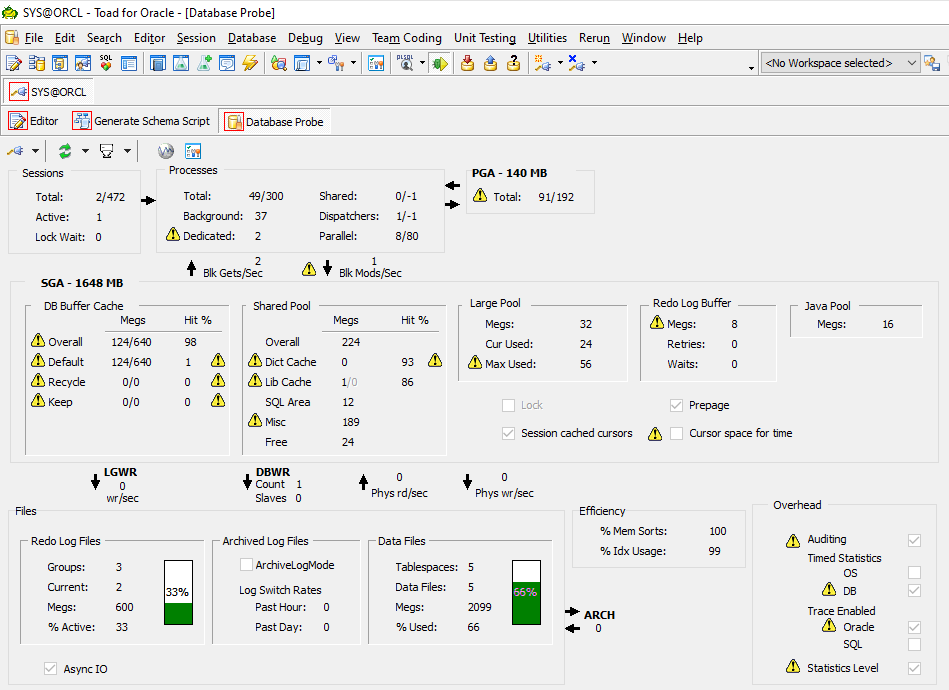
Database Probe
Database power and flexibility is the secret to superior database management
The Toad for Oracle DB Admin Module is rich with features that assist the DBA in maintaining database stability by being able to quickly identify and solve issues, adjust important settings in the database, configure and manage changes to schemas and even monitor vital areas including alert logs.
Watch the 12 minute video:
Get Toad for Oracle Base Subscription todaySubscription / eStore: buy up to 10 licenses at a time, get auto update, support, announcements/invites to education. Talk to our professionals: demos, custom solutions, volume discounts. Not ready to buy? Get Toad for Oracle a 3rd way … try it free for 30 days. |
Related information:
Blog: Toad for Oracle – DB Health Check
Learn more about database management system
Dan Hotka has several course offerings that use Toad and Toad Data Point.
Have questions or comments?
Head over to the Toad for Oracle forum on Toad World®! Chat with Toad developers and lots of experienced users.
Help your colleagues
If you think your colleagues would benefit from this blog, share it now on social media with the buttons located at the top of this blog post. Thanks!


Start the discussion at forums.toadworld.com