Nowadays in our work, we frequently face the task of presenting reports. That is why in this article we will introduce how we can design reports in a very simple way within the Toad for Oracle environment using the FastReport tool.
FastReport is the reporting engine in Toad that allows us to design customized and dynamic reports from a set of data.
From within the environment of Toad, we connect to our schema. For this demo, we connect to the SCOTT schema of the Oracle Database.
Once connected, we open the Schema Browser and select the EMP table. Then we select the Data tab.
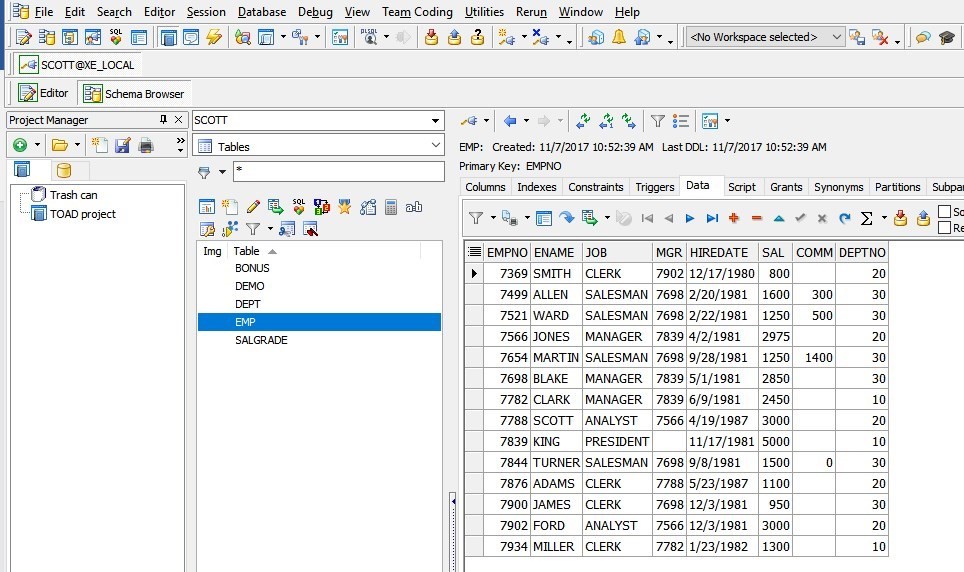
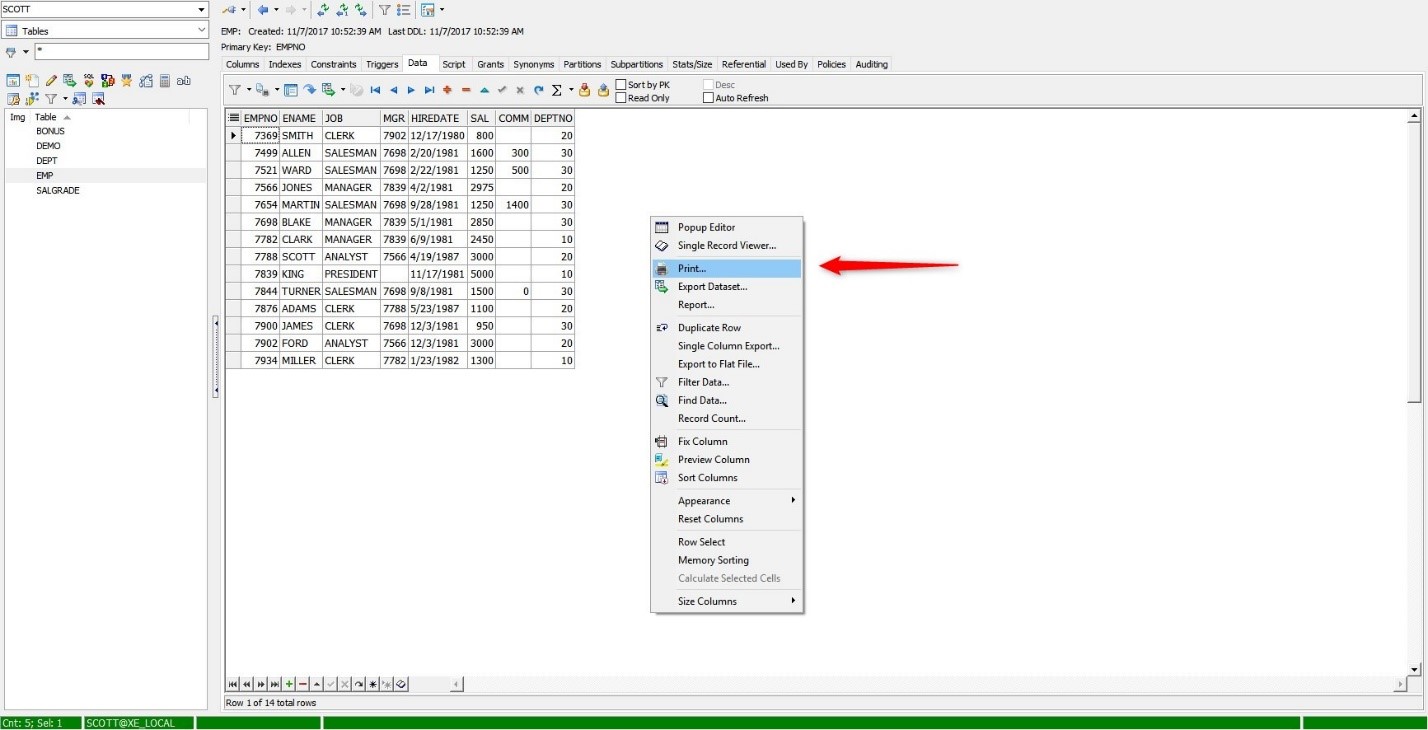
Toad allows us to easily print the data grid of the table. To do so, right-click on any data grid area and select Print from the pop-up menu.
The Print window opens to select the printer or we can also see a preview of the report by clicking on the Preview button.

To close the Preview window, click on the Close Print Preview button.
As you can see, this type of printing is the most basic and without personalization.
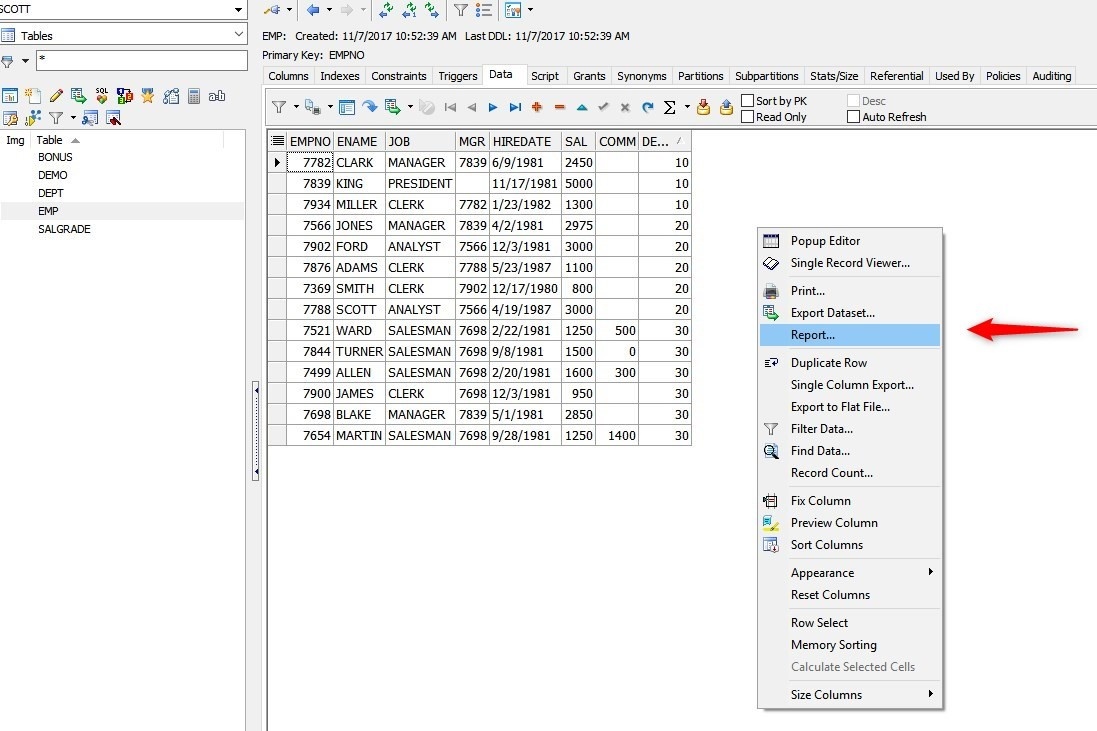
Before continuing, we will sort the EMP table by the DEPTNO column in ascending order. Then, to create a custom report of the data in the EMP table, right-click on any data grid area and select Report from the pop-up menu.
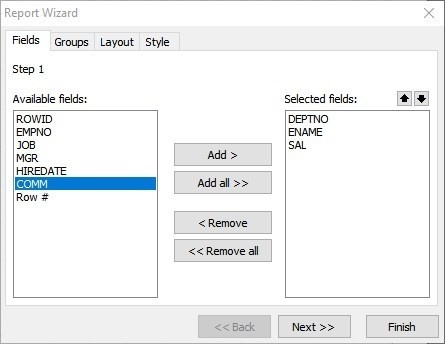
This opens the FastReport tool, displaying a wizard to create the report. This wizard has four tabs that control the fields, groups, layout, and style of the report.
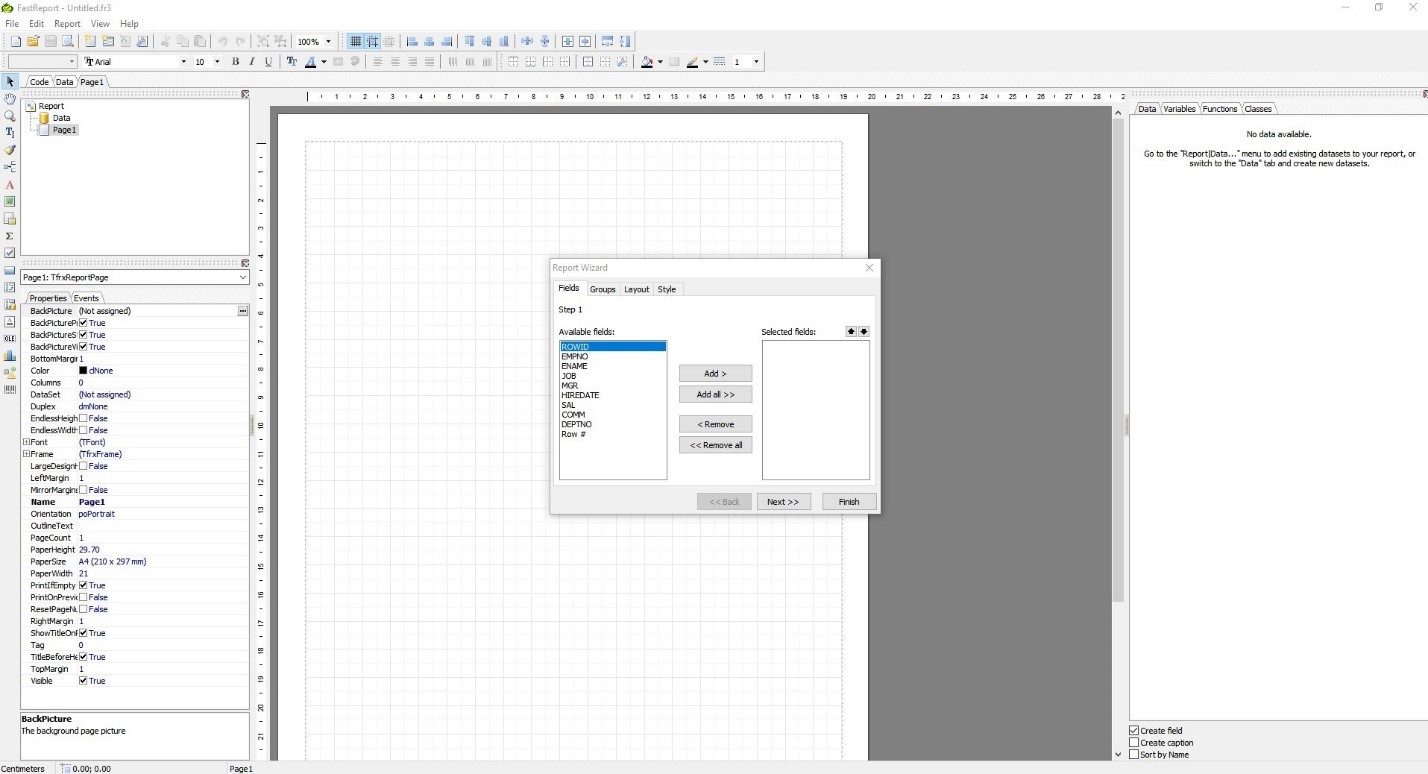
The first step corresponds to the tab labeled Fields, which allows us to select the columns that we want to show in the report. As an example, we will show the columns DEPTNO, ENAME and SAL.
We click on the Next button >>
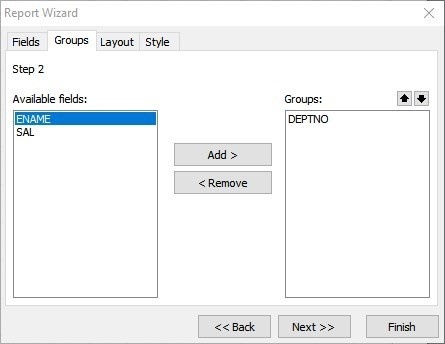
Step 2 corresponds to the Groups tab. Here, we select whether we want to group the data. For this example, we are going to group the employees by department number (DEPTNO).
We click on the Next button >>
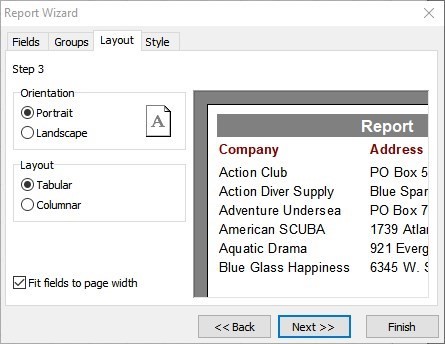
Step 3 corresponds to the Layout tab. We can select the orientation of the report and the layout type.
We click on the Next button >>
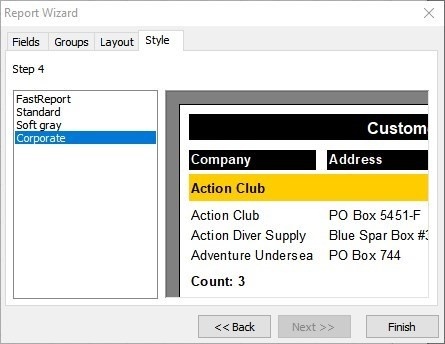
Step 4 corresponds to the Style tab. In here, we can select the style that we want to give to our report, and so we select the Corporate style as an example.
We click on the Finish button.
The report created in the designer is displayed.
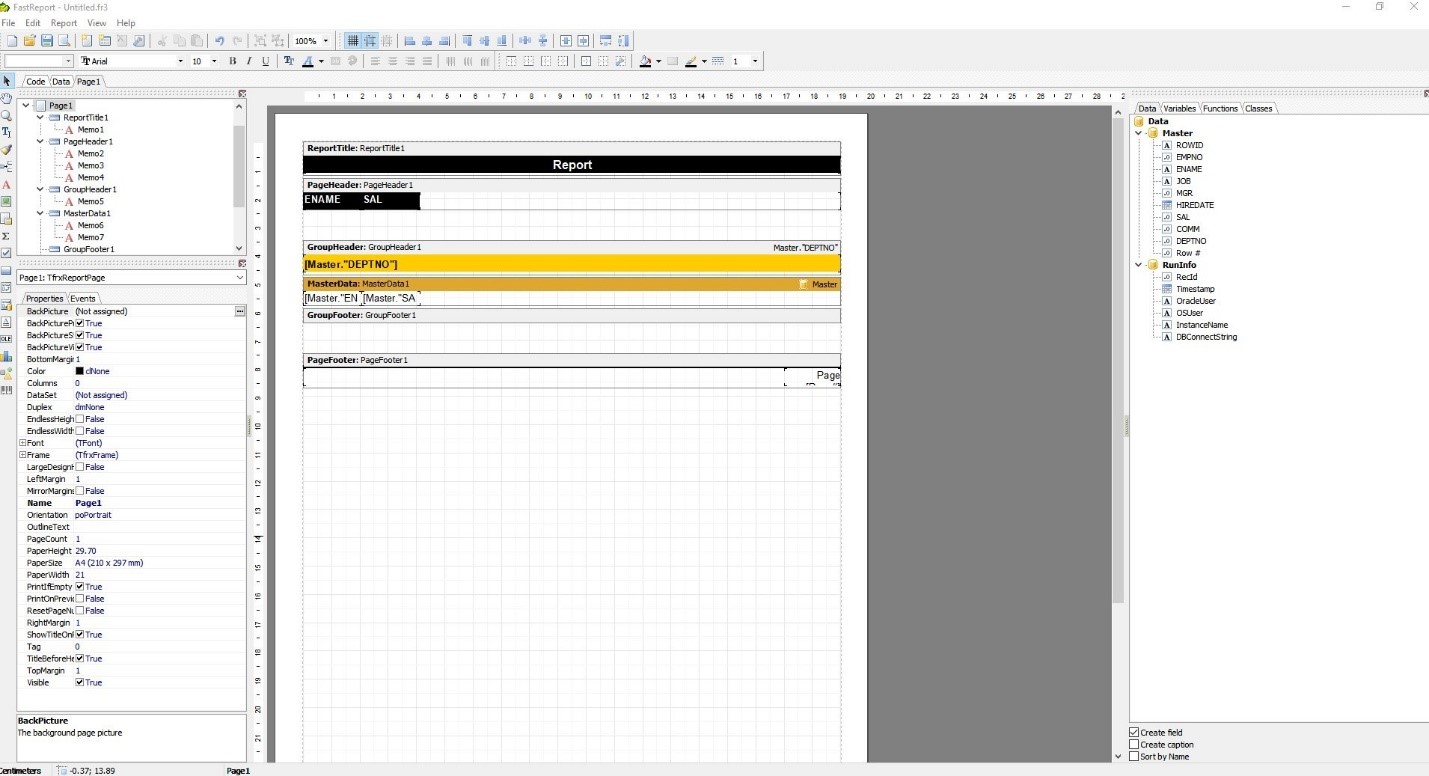
We can edit the names of columns and titles very easily. By selecting the desired element, for example, we select the title Report and with a double click we open the window to edit the name.
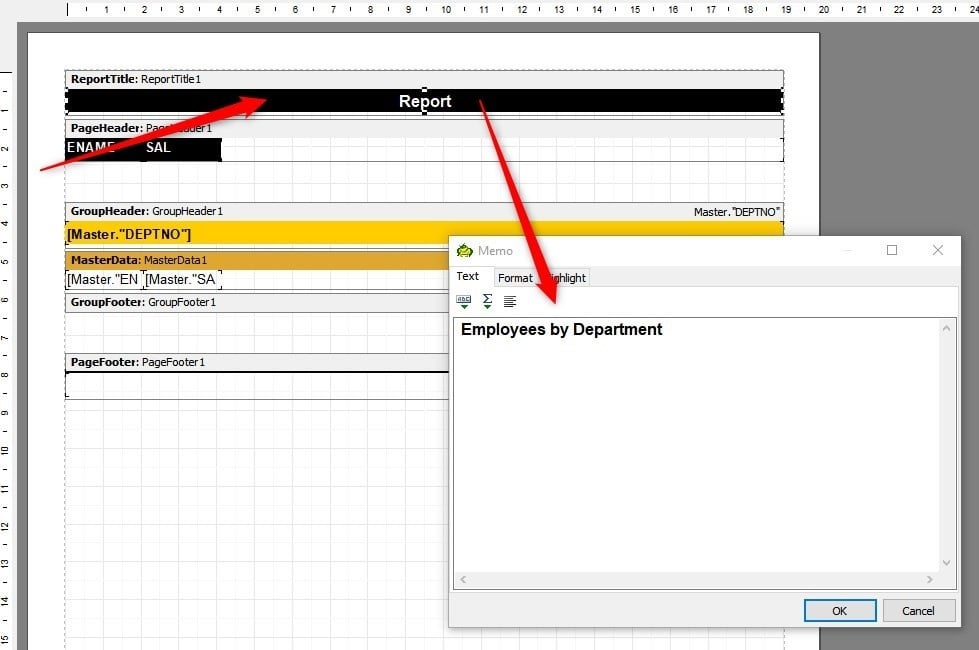
We click on the OK button to close the window.
We do the same for the name of the columns; we change ENAME to NAME and SAL to SALARY.
To visualize the report we click on the Code tab in the panel on the left and then click on the Run Script button (green arrow).
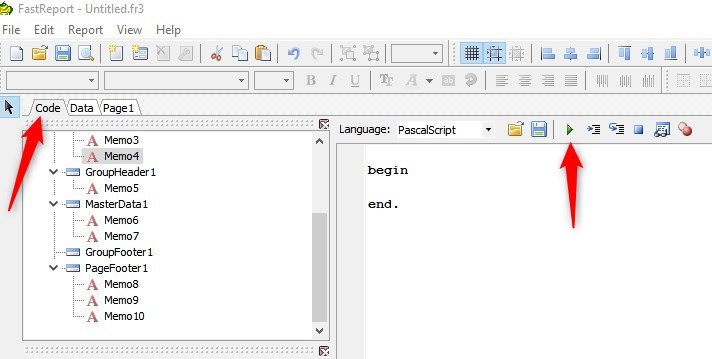
In this way, the SQL query of the report is executed and a preview of the report is displayed.

To close the Preview window and return to the report designer, click on the Close button.
We save the report created on our desktop with the name EMP_REPORT.
We close the report designer to return to the Toad environment.
In the next article we will learn how to add this report to the Toad Reports Manager.
Start the discussion at forums.toadworld.com