Introduction
Data changes frequently in OLTP environments and Oracle has to be aware of those changes or at least to try detect these changes in order to adjust the optimizer and execute sentences in the best possible way. To do so, Oracle generates several metrics from the system, from the session, from the services, etc., and also it gathers statistics automatically via AUTOTASK.
There is a huge amount of information generated by the metrics, which is captured mainly in AWR repository tables. The information generated by the metrics is very important because by using it the database administrators can perform troubleshooting and capacity planning, analyze the workload over a period of time, and so on. When there are no performance issues, database administrators mostly think about capacity planning in order to understand how the database is growing over time. In the past, this information was used to size the new hardware that they had to buy every two or three years, but with Oracle Cloud, that’s a thing of the past. Nowadays this information is used to understand different aspects of the growth of the business.
Businesses impose several different requirements; for example, a business might want to know about the increase in users consuming their services or products; the DBA would want to know about increased space requirements, increase in physical writes, and so on. These are among several scenarios where historical data is needed to create complex and customized reports.
When we think about historical data, our first thought is AWR/ASH; however, there is another alternative that few DBAs use: the repository views of Enterprise Manager. These views have hundreds of different metrics that are captured automatically by Enterprise Manager and can be used to create customized reports as complex as we could want. Just imagine, hundreds of metrics to play with!
As per Oracle "Database Licensing Information” (I didn’t find other sources of information on this), the following views also require Oracle Diagnostic Pack. If this license cannot be acquired you can use the STATSPACK tables.
MGMT$METRIC_DETAILS: The MGMT$METRIC_DETAILS view displays a rolling 7 day window of individual metric samples. These are the metric values for the most recent sample that has been loaded into the Management Repository plus any earlier samples that have not been aggregated into hourly statistics.
MGMT$METRIC_CURRENT: The MGMT$METRIC_CURRENT view displays information on the most recent metric values that have been loaded into the Management Repository.
MGMT$METRIC_HOURLY: The MGMT$METRIC_HOURLY view displays metric statistics information that has been aggregated from the individual metric samples into hourly time periods. For example, if a metric is collected every 15 minutes, the 1 hour rollup would aggregate the 4 samples into a single hourly value by averaging the 4 individual samples together. The current hour of statistics may not be immediately available from this view. The timeliness of the information provided from this view is dependent on when the query against the view was executed and when the hourly rollup table was last refreshed.
MGMT$METRIC_DAILY: The MGMT$METRIC_DAILY view displays metric statistics that have been aggregated from the samples collected over the previous twenty-four hour time period. The timeliness of the information provided from this view is dependent on when the query against the view was executed and when the hourly rollup table was last refreshed.
MGMT$TARGET_TYPE: MGMT$TARGET_TYPE displays metric descriptions for a given target name and target type. This information is available for the metrics for the managed targets that have been loaded into the Management Repository. Metrics are specific to the target type.
You can build reports as complex as you want. In this article I will show you some basic examples that you can take as a starting point. You can also read my article “Creación de un reporte simple usando Information Publisher Report”, where you will learn how to use Infomration Publisher to build nice reports.
List all the metrics available in Enterprise Manager Repository Views
With this query you can list all the metrics that you can use to build your reports. This query will return hundreds of rows, each row for one specific metric:
SELECT distinct metric_name,
metric_column,
metric_label,
metric_column
FROM MGMT$METRIC_DAILY
ORDER BY 1,2,3;
All the metrics for all the database targets
With this query you list all the metrics available for one specific type of target, in this case the type ‘oracle_database’:
SELECT t.target_name target_name,
       t.metric_name,
       m.metric_column metric_column,
       to_char(m.rollup_timestamp,'YYYY-MM-DD HH24') as TIME,
       sum(m.average/1024) as value
FROM   mgmt$metric_hourly M,
       mgmt$target_type T
WHERE  t.target_type='oracle_database'
       and m.target_guid=t.target_guid
       and m.metric_guid=t.metric_guid
GROUP BY  t.target_name,
          t.metric_name,
          m.metric_column,
          m.rollup_timestamp
ORDER BY 1,2,3;
Once you know which metrics are available to build reports, you can proceed to create a basic report.
Current value for the metric iombs_ps
Let’s start with something basic: learning the current value for one specific metric. In this example, we’ll learn the value of the metric “iombs_ps”, which is part of the category “instance_throughput”.
This query uses the view mgmt$metric_current:
SQL> SELECT t.target_name target_name,
     t.metric_name,
     m.metric_column metric_column,
     to_char(m.collection_timestamp,'YYYY-MM-DD HH24:MI') as TIME,
     m.value as value
FROM mgmt$metric_current M,
     mgmt$target_type T
WHERE t.target_type='oracle_database'
      and m.target_guid=t.target_guid
      and m.metric_guid=t.metric_guid
      and t.metric_name='instance_throughput'
      and t.metric_column='iombs_ps'
      ORDER BY 1,2,3;

TARGET_NAME  METRIC_NAME         METRIC_COLUMN TIME             VALUE
------------ ------------------- ------------- ---------------- --------
cloud1       instance_throughput iombs_ps      2017-08-20 20:32 378
Historic data for the metric iombs_ps per hour
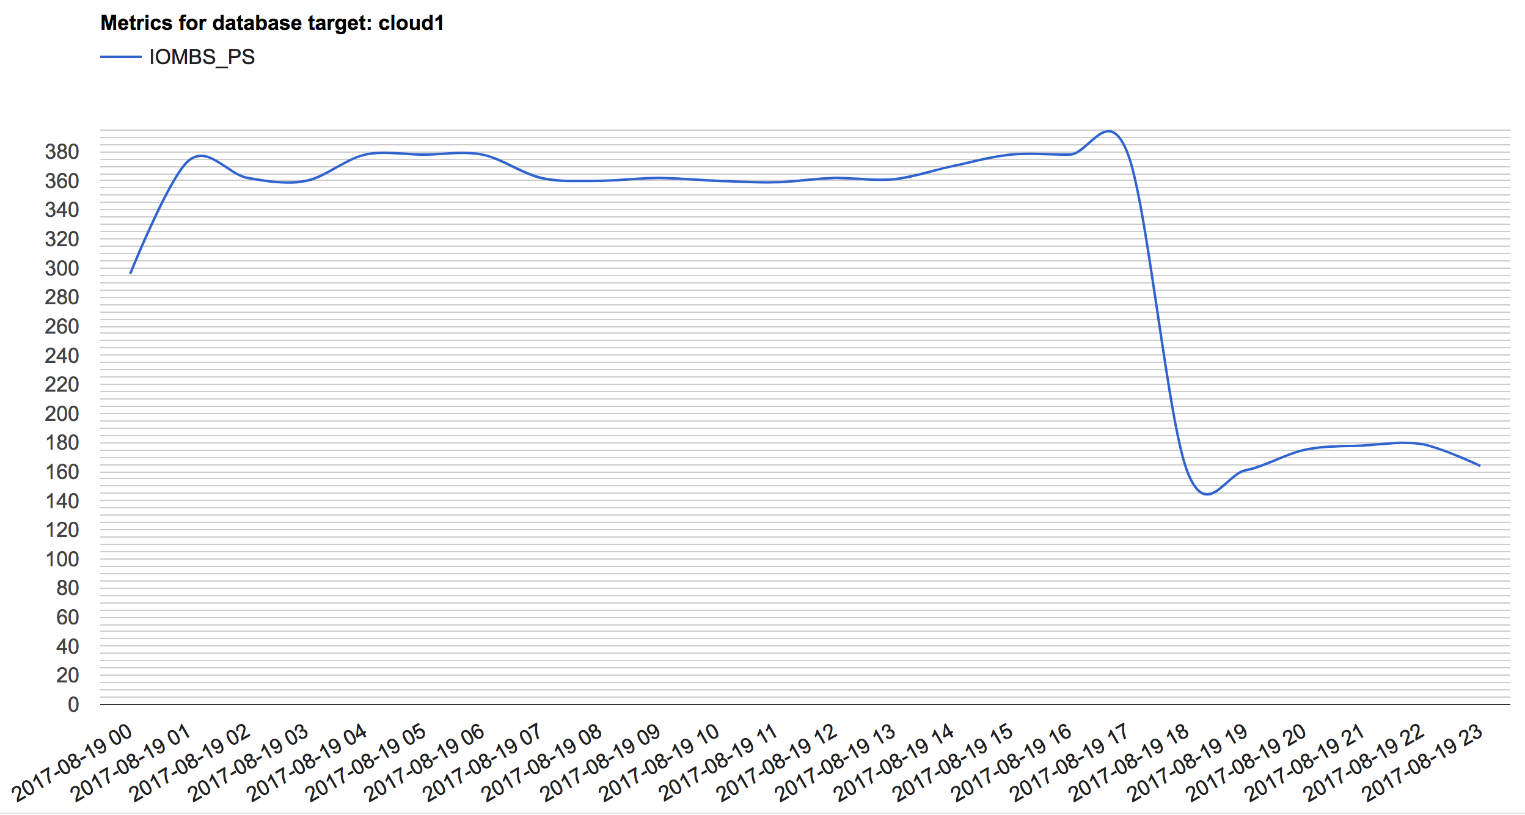
Now I will use the historic data for the same metric for the last 24 hours and then I will build a chart with Google Chart to see the behavior of this metric across the time. This query uses the view mgmt$metric_hourly.
SQL> SELECT t.target_name target_name,
            t.metric_name,
            m.metric_column metric_column,
            to_char(m.rollup_timestamp,'YYYY-MM-DD HH24') as TIME,
            sum(m.average/1024) as value
FROM        mgmt$metric_hourlyM,
            mgmt$target_type T
WHERE       t.target_type='oracle_database'
            and m.target_guid=t.target_guid
            and m.metric_guid=t.metric_guid
            and t.metric_name='instance_throughput'
            and t.metric_column='iombs_ps'
GROUP BY t.target_name,
         t.metric_name,
         m.metric_column,
         m.rollup_timestamp
ORDER BY 1,2,3;

TARGET_NAME  METRIC_NAME          METRIC_COLUMN   MONTH_TIMESTA VALUE
------------ -------------------- --------------- ------------- ----------
cloud1       instance_throughput  iombs_ps        2017-08-19 00 296
cloud1       instance_throughput  iombs_ps        2017-08-19 01 374
cloud1       instance_throughput  iombs_ps        2017-08-19 02 362
cloud1       instance_throughput  iombs_ps        2017-08-19 03 360
cloud1       instance_throughput  iombs_ps        2017-08-19 04 378
cloud1       instance_throughput  iombs_ps        2017-08-19 05 378
cloud1       instance_throughput  iombs_ps        2017-08-19 06 378
cloud1       instance_throughput  iombs_ps        2017-08-19 07 362
cloud1       instance_throughput  iombs_ps        2017-08-19 08 360
cloud1       instance_throughput  iombs_ps        2017-08-19 09 362
cloud1       instance_throughput  iombs_ps        2017-08-19 10 360
cloud1       instance_throughput  iombs_ps        2017-08-19 11 359
cloud1       instance_throughput  iombs_ps        2017-08-19 12 362
cloud1       instance_throughput  iombs_ps        2017-08-19 13 361
cloud1       instance_throughput  iombs_ps        2017-08-19 14 370
cloud1       instance_throughput  iombs_ps        2017-08-19 15 378
cloud1       instance_throughput  iombs_ps        2017-08-19 16 378
cloud1       instance_throughput  iombs_ps        2017-08-19 17 378
cloud1       instance_throughput  iombs_ps        2017-08-19 18 161
cloud1       instance_throughput  iombs_ps        2017-08-19 19 161
cloud1       instance_throughput  iombs_ps        2017-08-19 20 175
cloud1       instance_throughput  iombs_ps        2017-08-19 21 178
cloud1       instance_throughput  iombs_ps        2017-08-19 22 179
cloud1       instance_throughput  iombs_ps        2017-08-19 23 164
cloud1       instance_throughput  iombs_ps        2017-08-19 24 160
Now I will use Google Chart to chart the data. We can see that interpreting a graphic is easier than looking only at numbers. In this graphic we can see that something happened around 17:00 because the IO throughput decreased:

Historic data for the metric iombs_ps per day
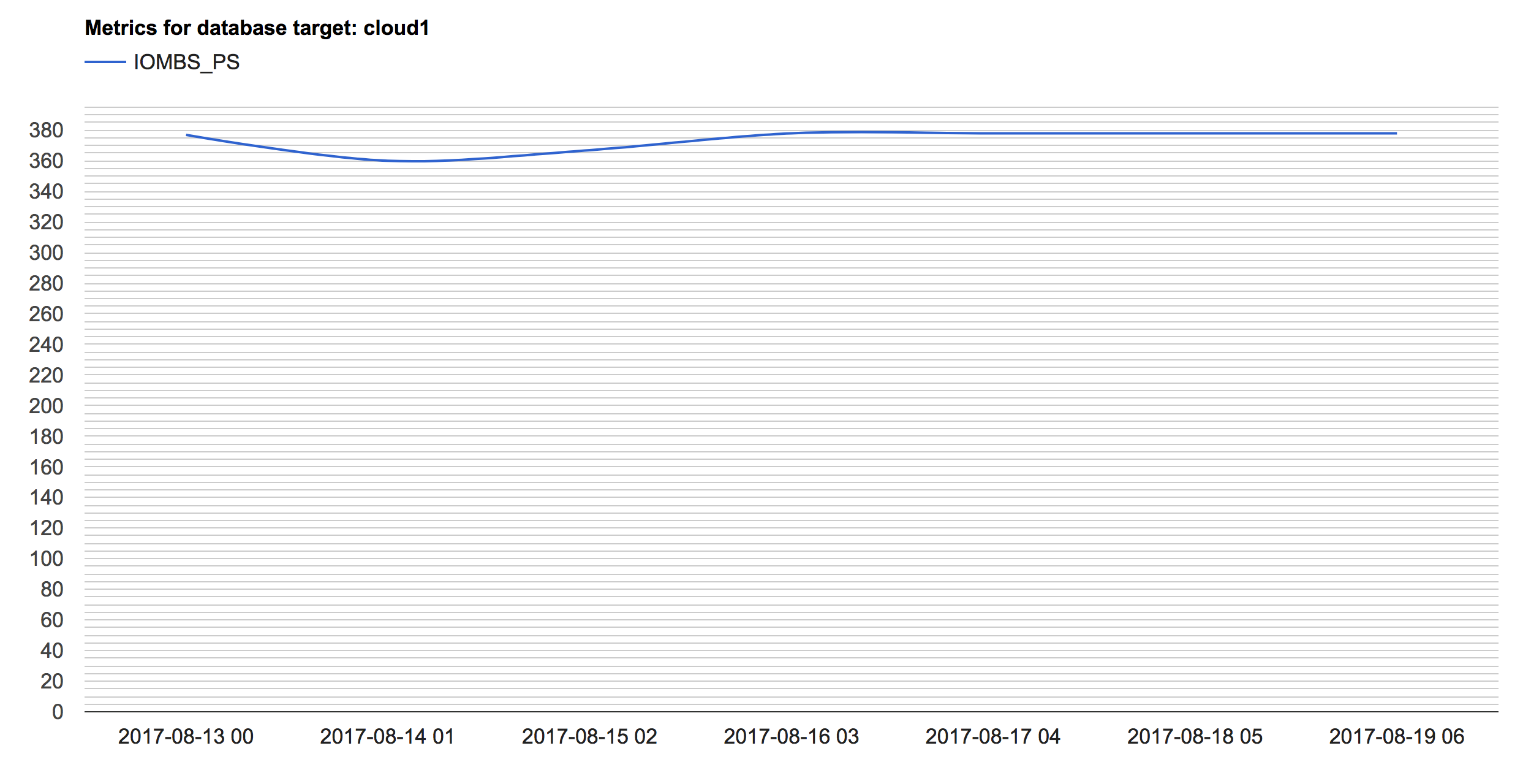
Our last report example will use the view mgmt$metric_daily to create a report on the same metric, but daily. You can add more WHERE clauses to filter the period of time and also you can play with the values MAXIMUM and MINIMUM.
SQL> SELECT t.target_name target_name,
            t.metric_name,
            m.metric_column metric_column,
            to_char(m.rollup_timestamp,'YYYY-MM-DD') as TIME,
            sum(m.average/1024) as value
FROM        mgmt$metric_daily M,
            mgmt$target_type T
WHERE       t.target_type='oracle_database'
            and m.target_guid=t.target_guid
            and m.metric_guid=t.metric_guid
            and t.metric_name='instance_throughput'
            and t.metric_column='iombs_ps'
GROUP BY t.target_name, t.metric_name, m.metric_column, m.rollup_timestamp
ORDER BY 1,2,3;

TARGET_NAME  METRIC_NAME          METRIC_COLUMN   MONTH_TIME VALUE
------------ -------------------- --------------- ---------- ----------
cloud1       instance_throughput  iombs_ps        2017-08-13 377
cloud1       instance_throughput  iombs_ps        2017-08-14 360
cloud1       instance_throughput  iombs_ps        2017-08-15 367
cloud1       instance_throughput  iombs_ps        2017-08-16 378
cloud1       instance_throughput  iombs_ps        2017-08-17 378
cloud1       instance_throughput  iombs_ps        2017-08-18 378
cloud1       instance_throughput  iombs_ps        2017-08-19 378

Conclusion
In this article I have showed you one more historic data source that you can use to understand the behavior of your business through hundreds of metrics that are available in the Enterprise Manager Repository Views. You have views to see the current value of the metrics, the hourly value, or the daily value, and can play with values like the MAXIMUM in a day (or in an hour), MINUMUM, or AVERAGE. You can create very complex queries to analyze different problems across time, and then you can chart the data and get nice graphics that you can present to the board.
Start the discussion at forums.toadworld.com