I very frequently come across DBA's that that are either overwhelmed with the complexity of their organizations enterprise monitoring platform, or underwhelmed with its out of the box monitoring and diagnostic capabilities. These DBA's typically look towards a solution such as Spotlight on SQL Server Enterprise to provide them with simple, yet powerful, SQL Server monitoring and diagnostics. In an effort to help customers leverage the simplicity and power of Spotlight, yet integrate critical alarms/issues into their enterprise monitoring system, I decided to create this post to describe the process.
As of Spotlight on SQL Server Enterprise version 10.0, the Alarm Actions capability allows you to take certain alarms, and log their details to the Windows Event Log. These event log entries, can then be pulled into your enterprise monitoring tool, and handled according to however your organization wishes. The following steps show the Spotlight side of this integration:
-
Assuming your alarms and thresholds are configured according to your requirements, create an alarm action by navigating to the Configure -> Alarm Actions interface

-
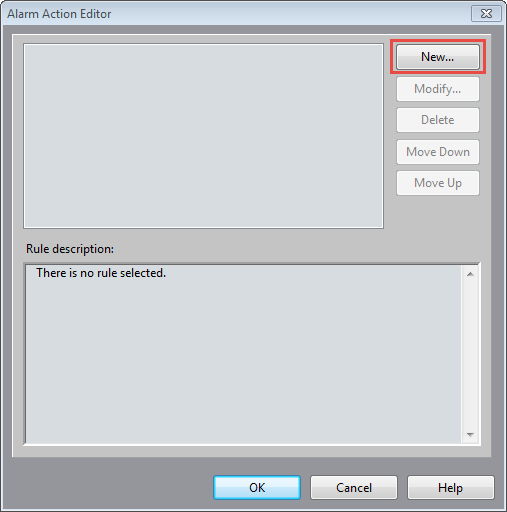
Click on the "New" button to define a new alarm action:
-
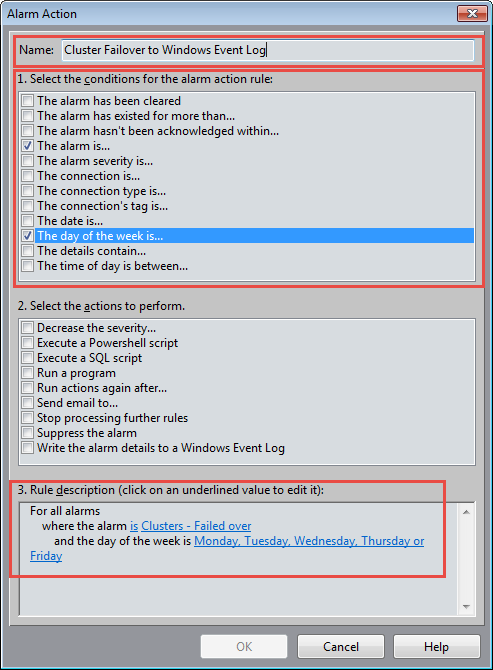
After giving your alarm action a name, define the condition that you will use to determine which alarms you wish this action to take place over. In this example, we will choose the Cluster Failover alarm, across all servers, when it occurs Monday through Friday:
-
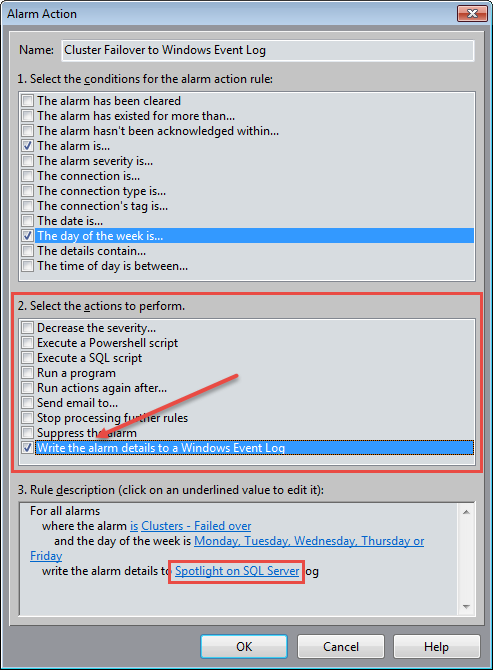
With the condition now defined, check off the "Write the alarm details to a Windows Event Log" action as shown below.
-
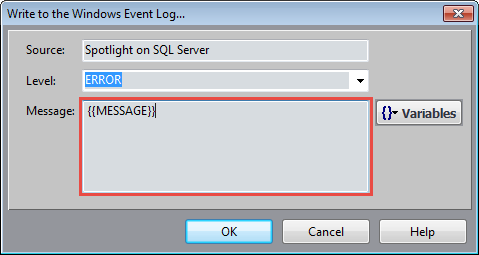
Clicking on the highlighted text above (Spotlight on SQL Server) will allow you to configure the source, level, and message that will be recorded to the event log. The message cannot be blank. You can enter whatever text you wish, or click on the "Variables" dropdown for alarm specific information. In this example, I will let Spotlight record it's alarm "Message" into the event log:
-
Now with the Alarm Action configured as above, when the action takes place you will see the event log entry recorded on the Spotlight Diagnostic Server. Below you can see an example of the event log entry as configured:
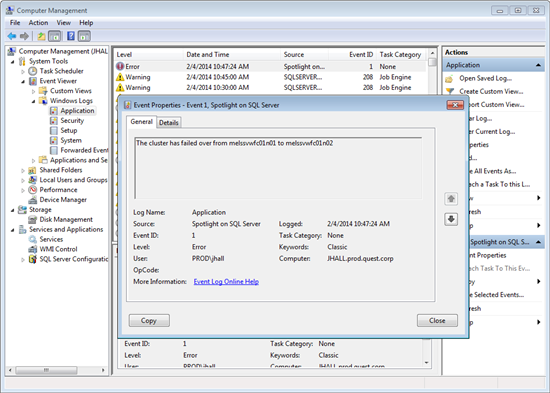
The rest of this configuration is dependent on your enterprise monitoring platform. Point it to the Windows Event Log on the Spotlight Diagnostic Server and set up filters to grab and take action on these Spotlight created entries.
I hope this is helpful, let me know if there are any questions!
Start the discussion at forums.toadworld.com